


KL, MY • 4.2105° N • 101.9758° E
Improving Data Catalog Repository
Revamping a monitoring system dashboard, crafted a sleek and visually dynamic interface to effectively communicate real-time data, providing an enhanced user experience.
Services
UX Design, Design System, Interaction Design
Client
Current Company
Tools
Figma, Miro
Year
2025
About the project
About the project
About the project
We worked on redesigning the UI for a machine that includes a series of high-precision gas analyzers, mainly utilized to monitor impurities in the semiconductor wafer manufacturing process. The machine is managed and operated via a dashboard UI. Our task was to enhance the UI to make it more user-friendly, both for in-factory use and remote access.
We worked on redesigning the UI for a machine that includes a series of high-precision gas analyzers, mainly utilized to monitor impurities in the semiconductor wafer manufacturing process. The machine is managed and operated via a dashboard UI. Our task was to enhance the UI to make it more user-friendly, both for in-factory use and remote access.
We worked on redesigning the UI for a machine that includes a series of high-precision gas analyzers, mainly utilized to monitor impurities in the semiconductor wafer manufacturing process. The machine is managed and operated via a dashboard UI. Our task was to enhance the UI to make it more user-friendly, both for in-factory use and remote access.
Business Goal
Business Goal
Business Goal
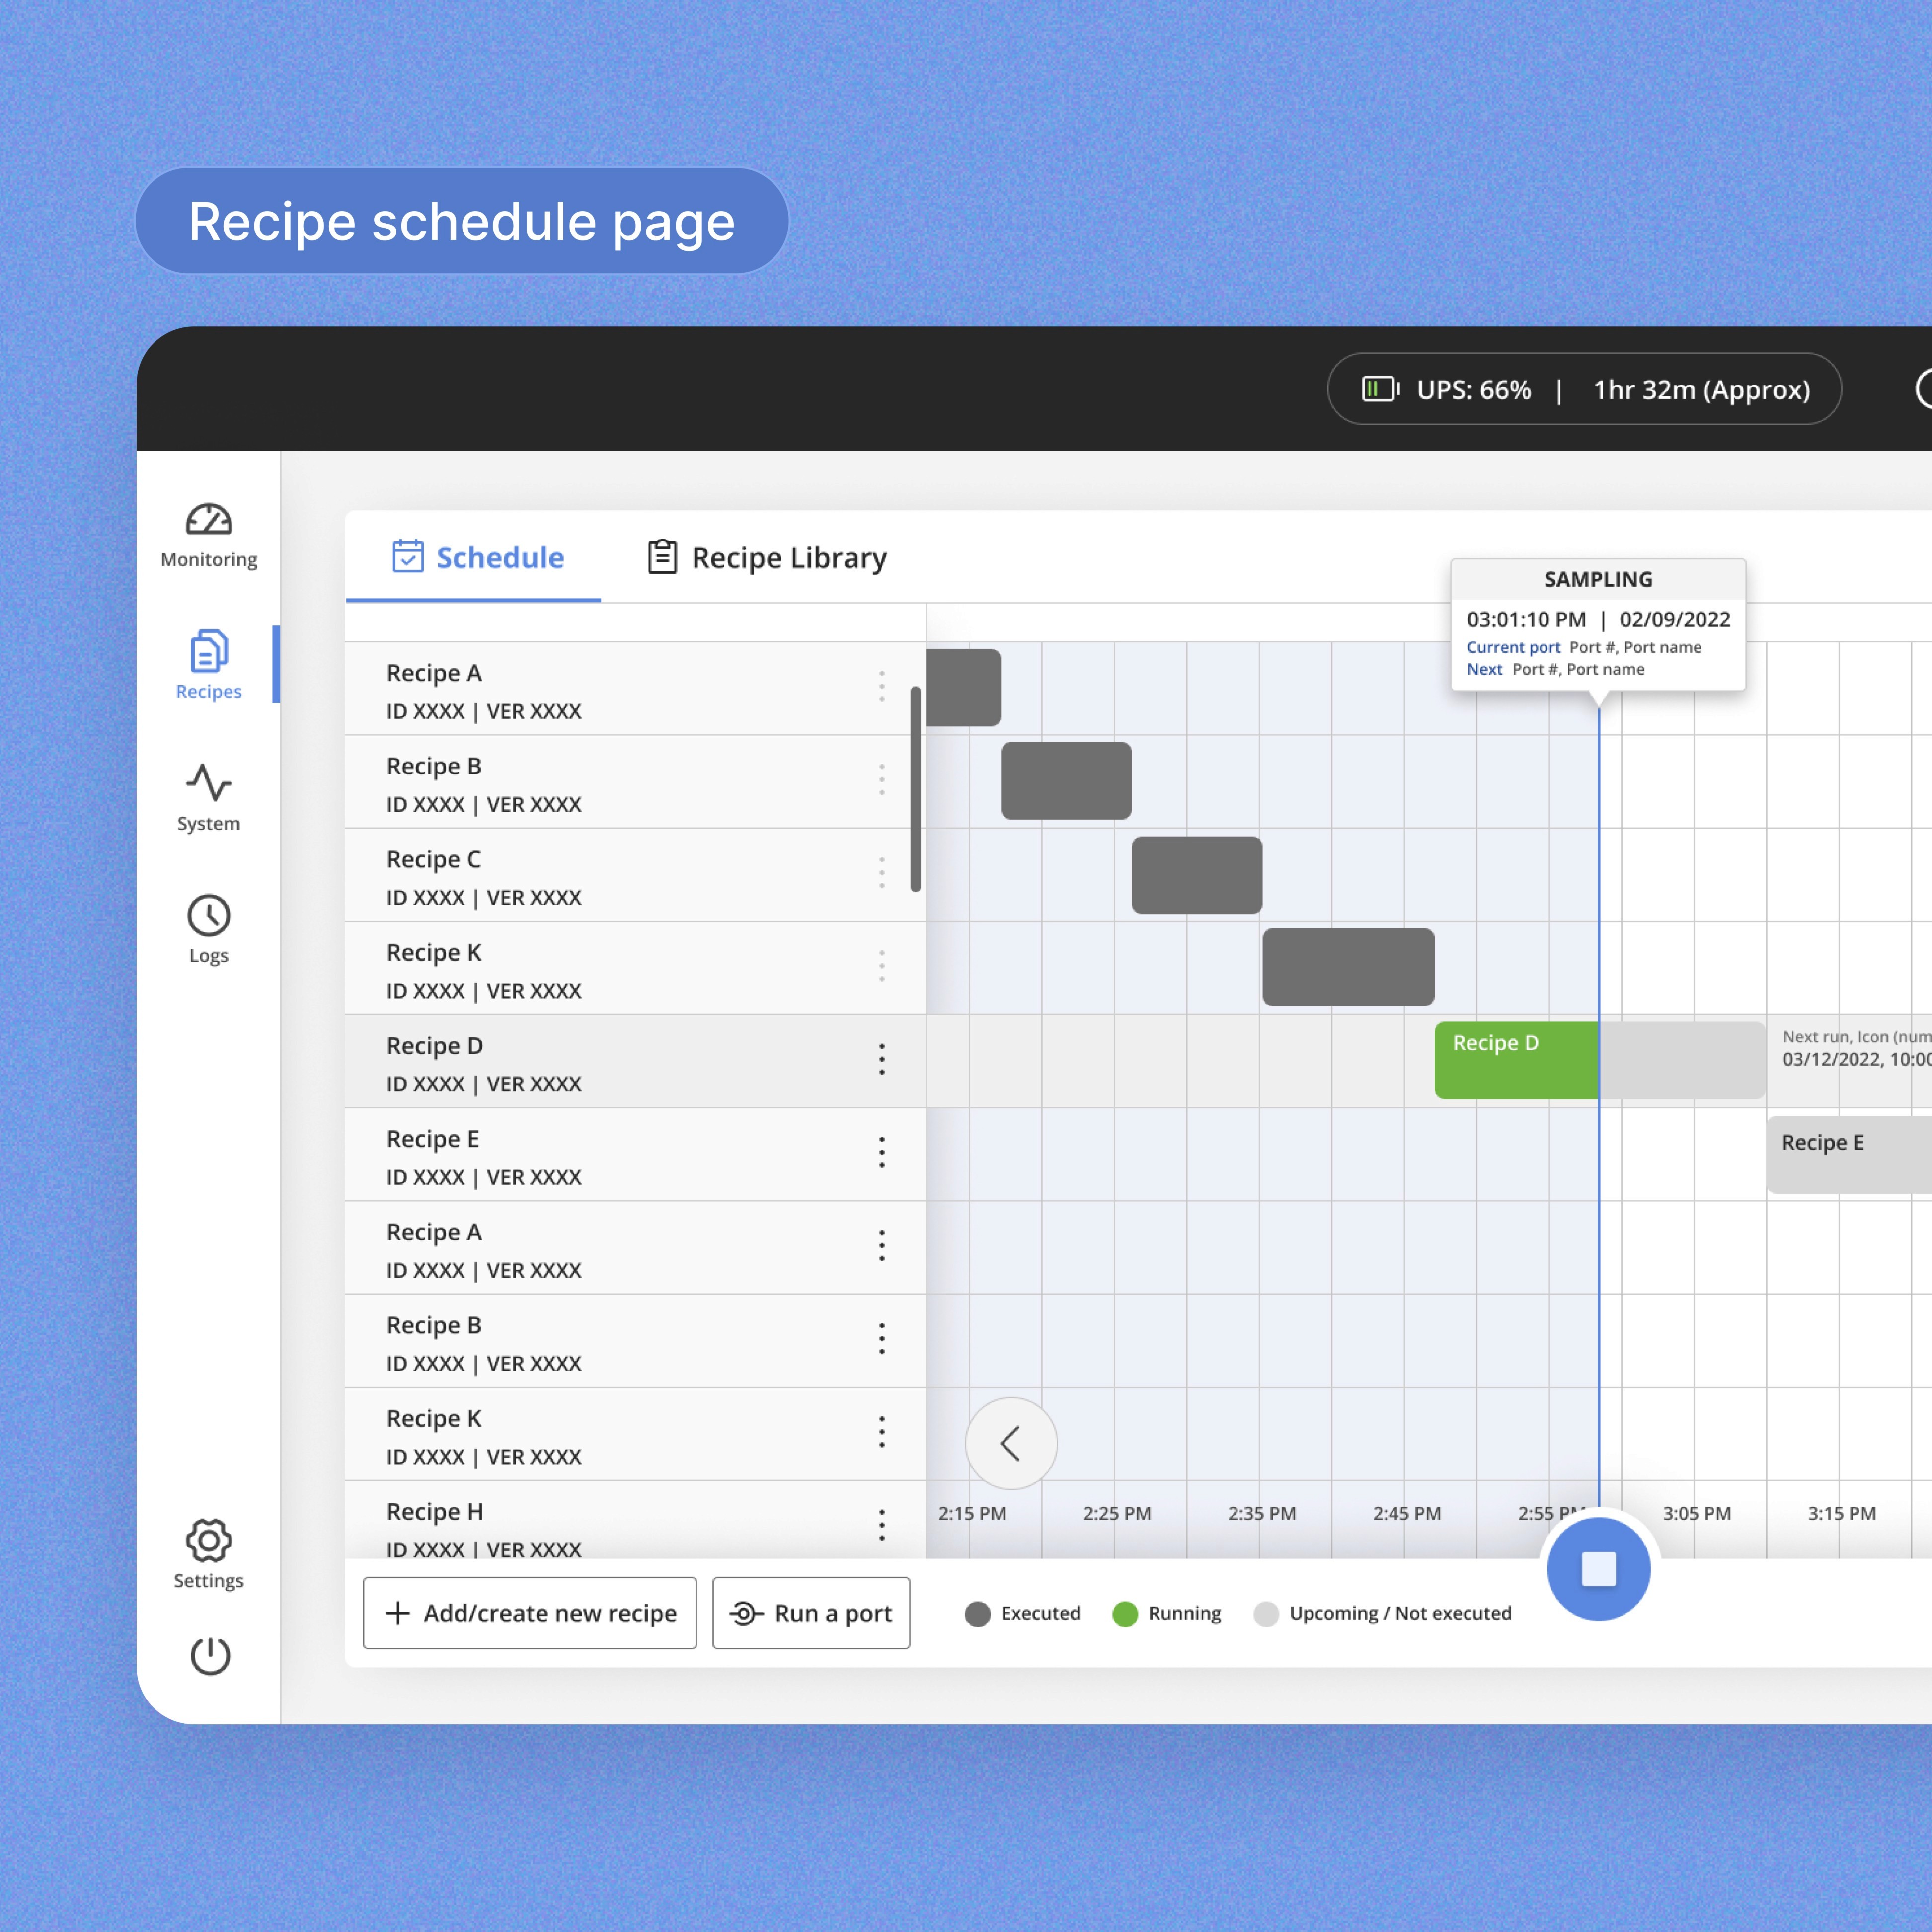
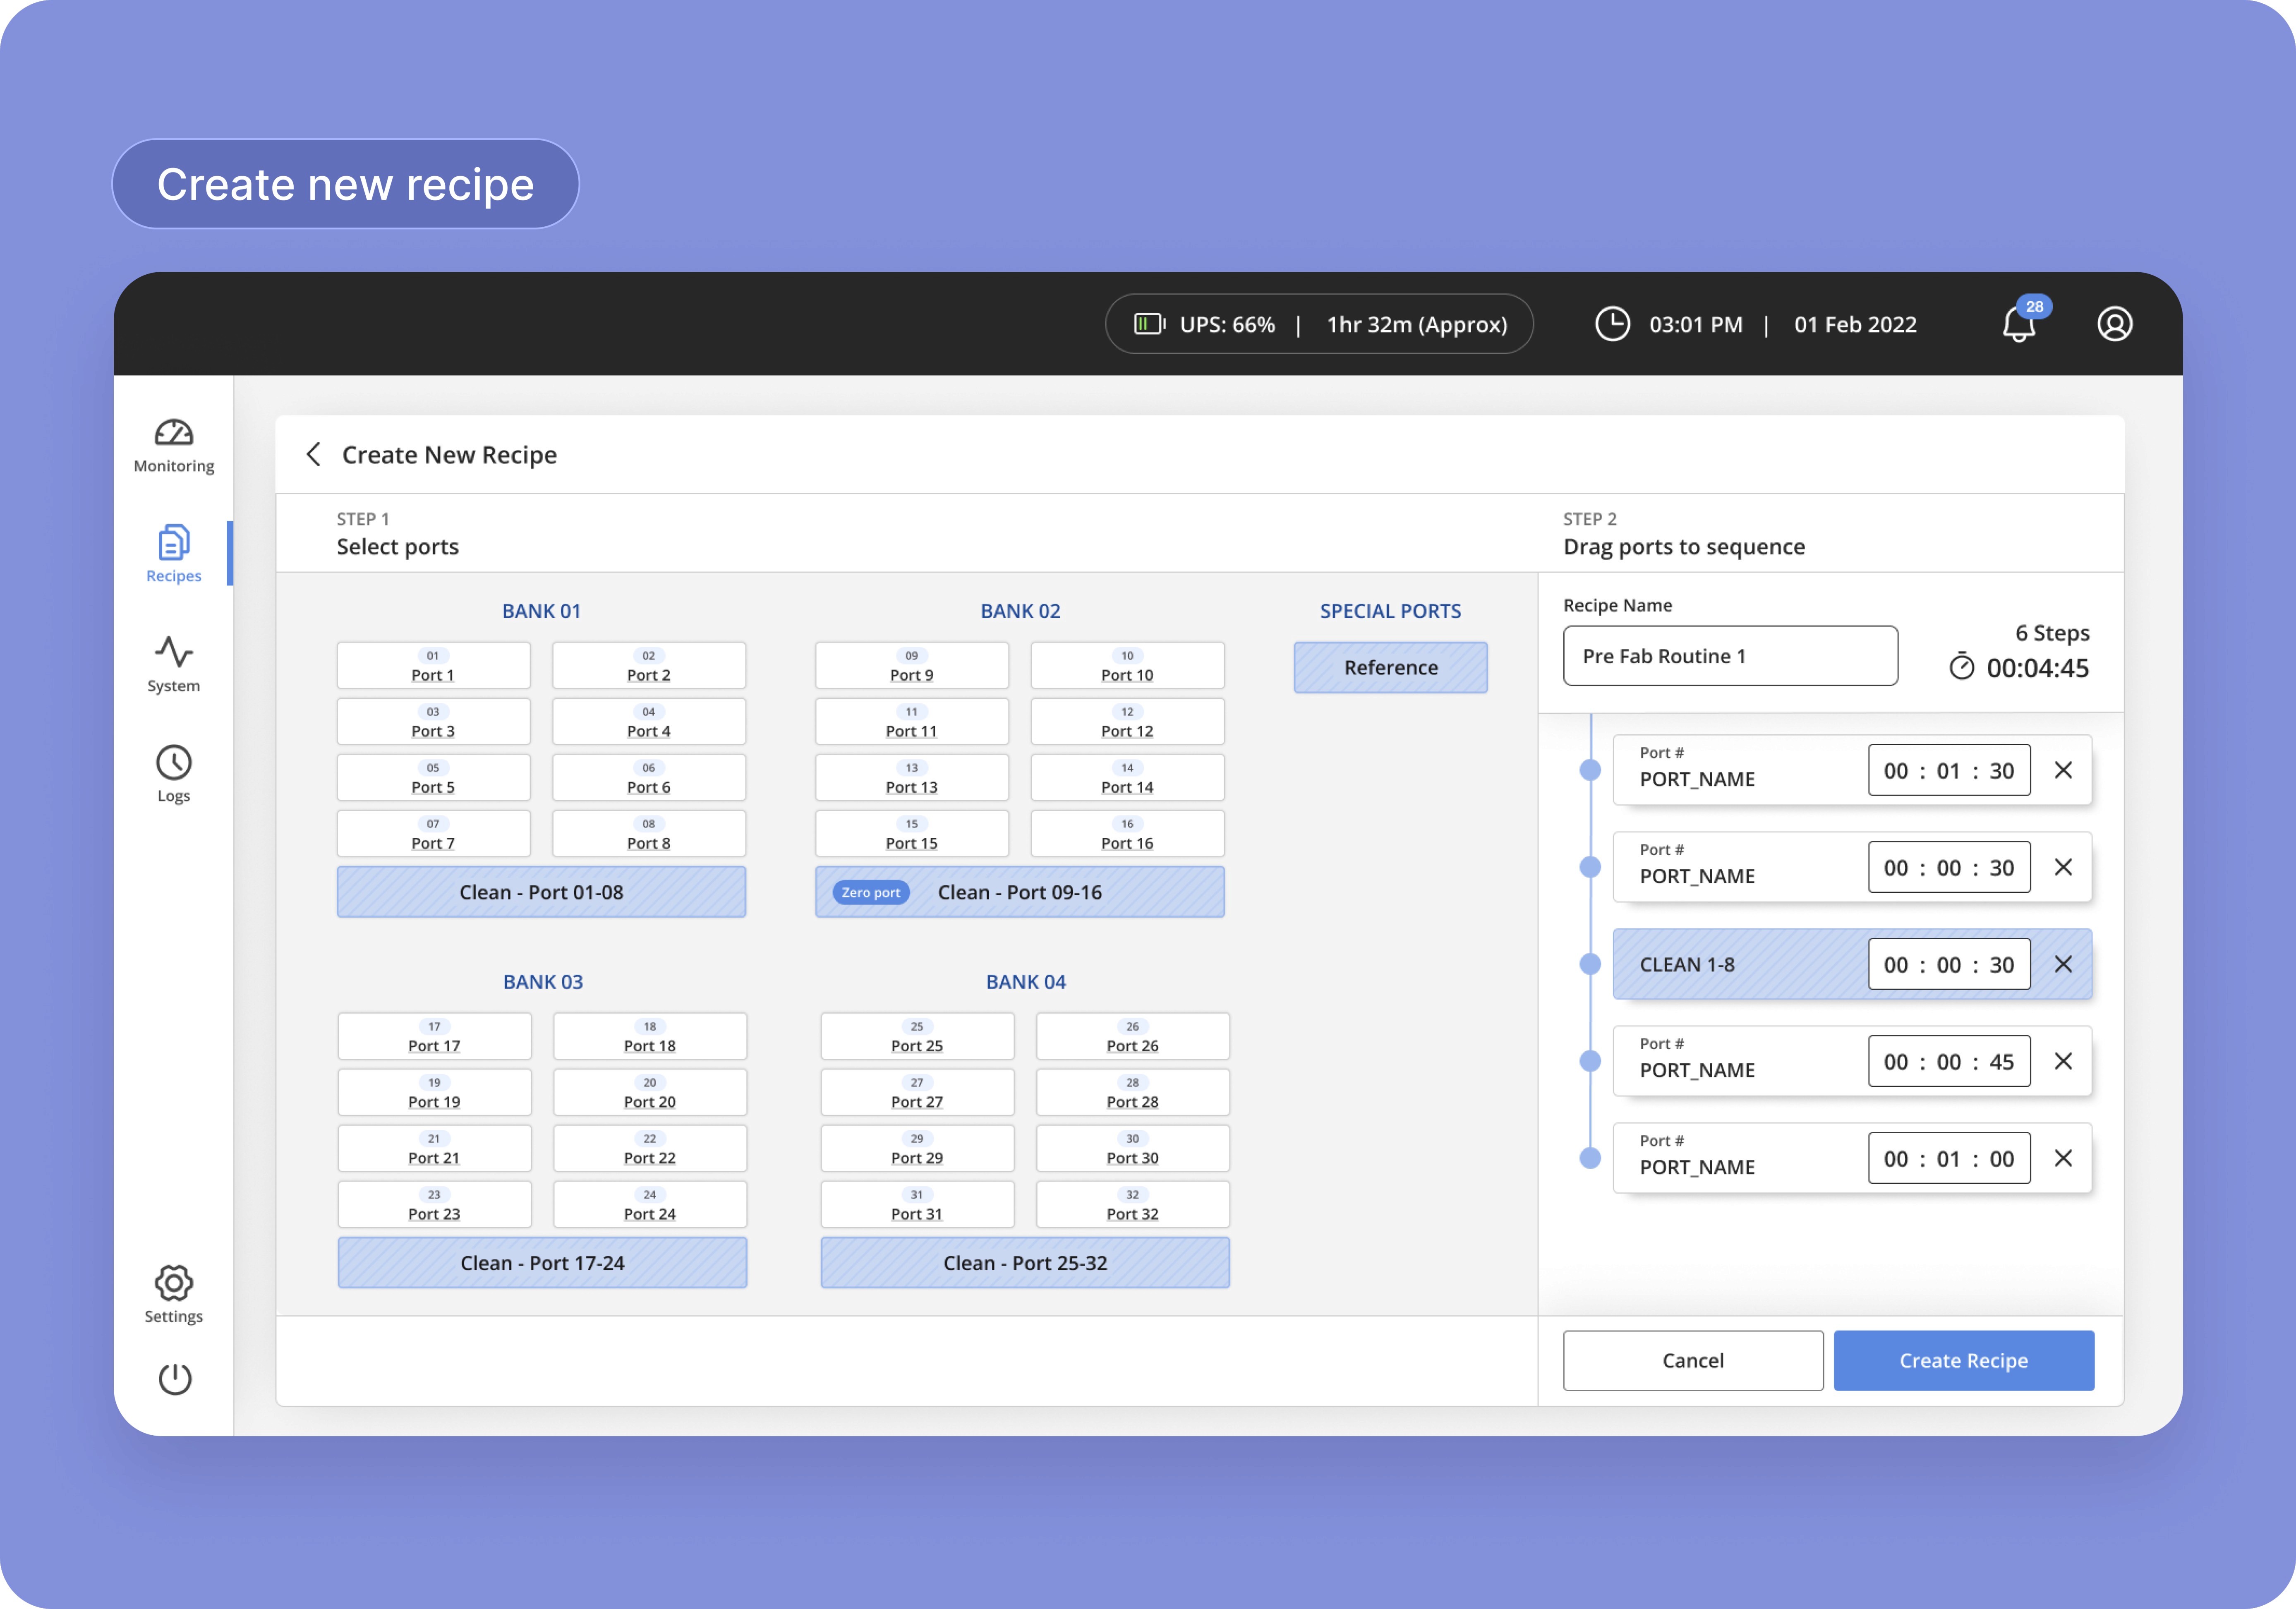
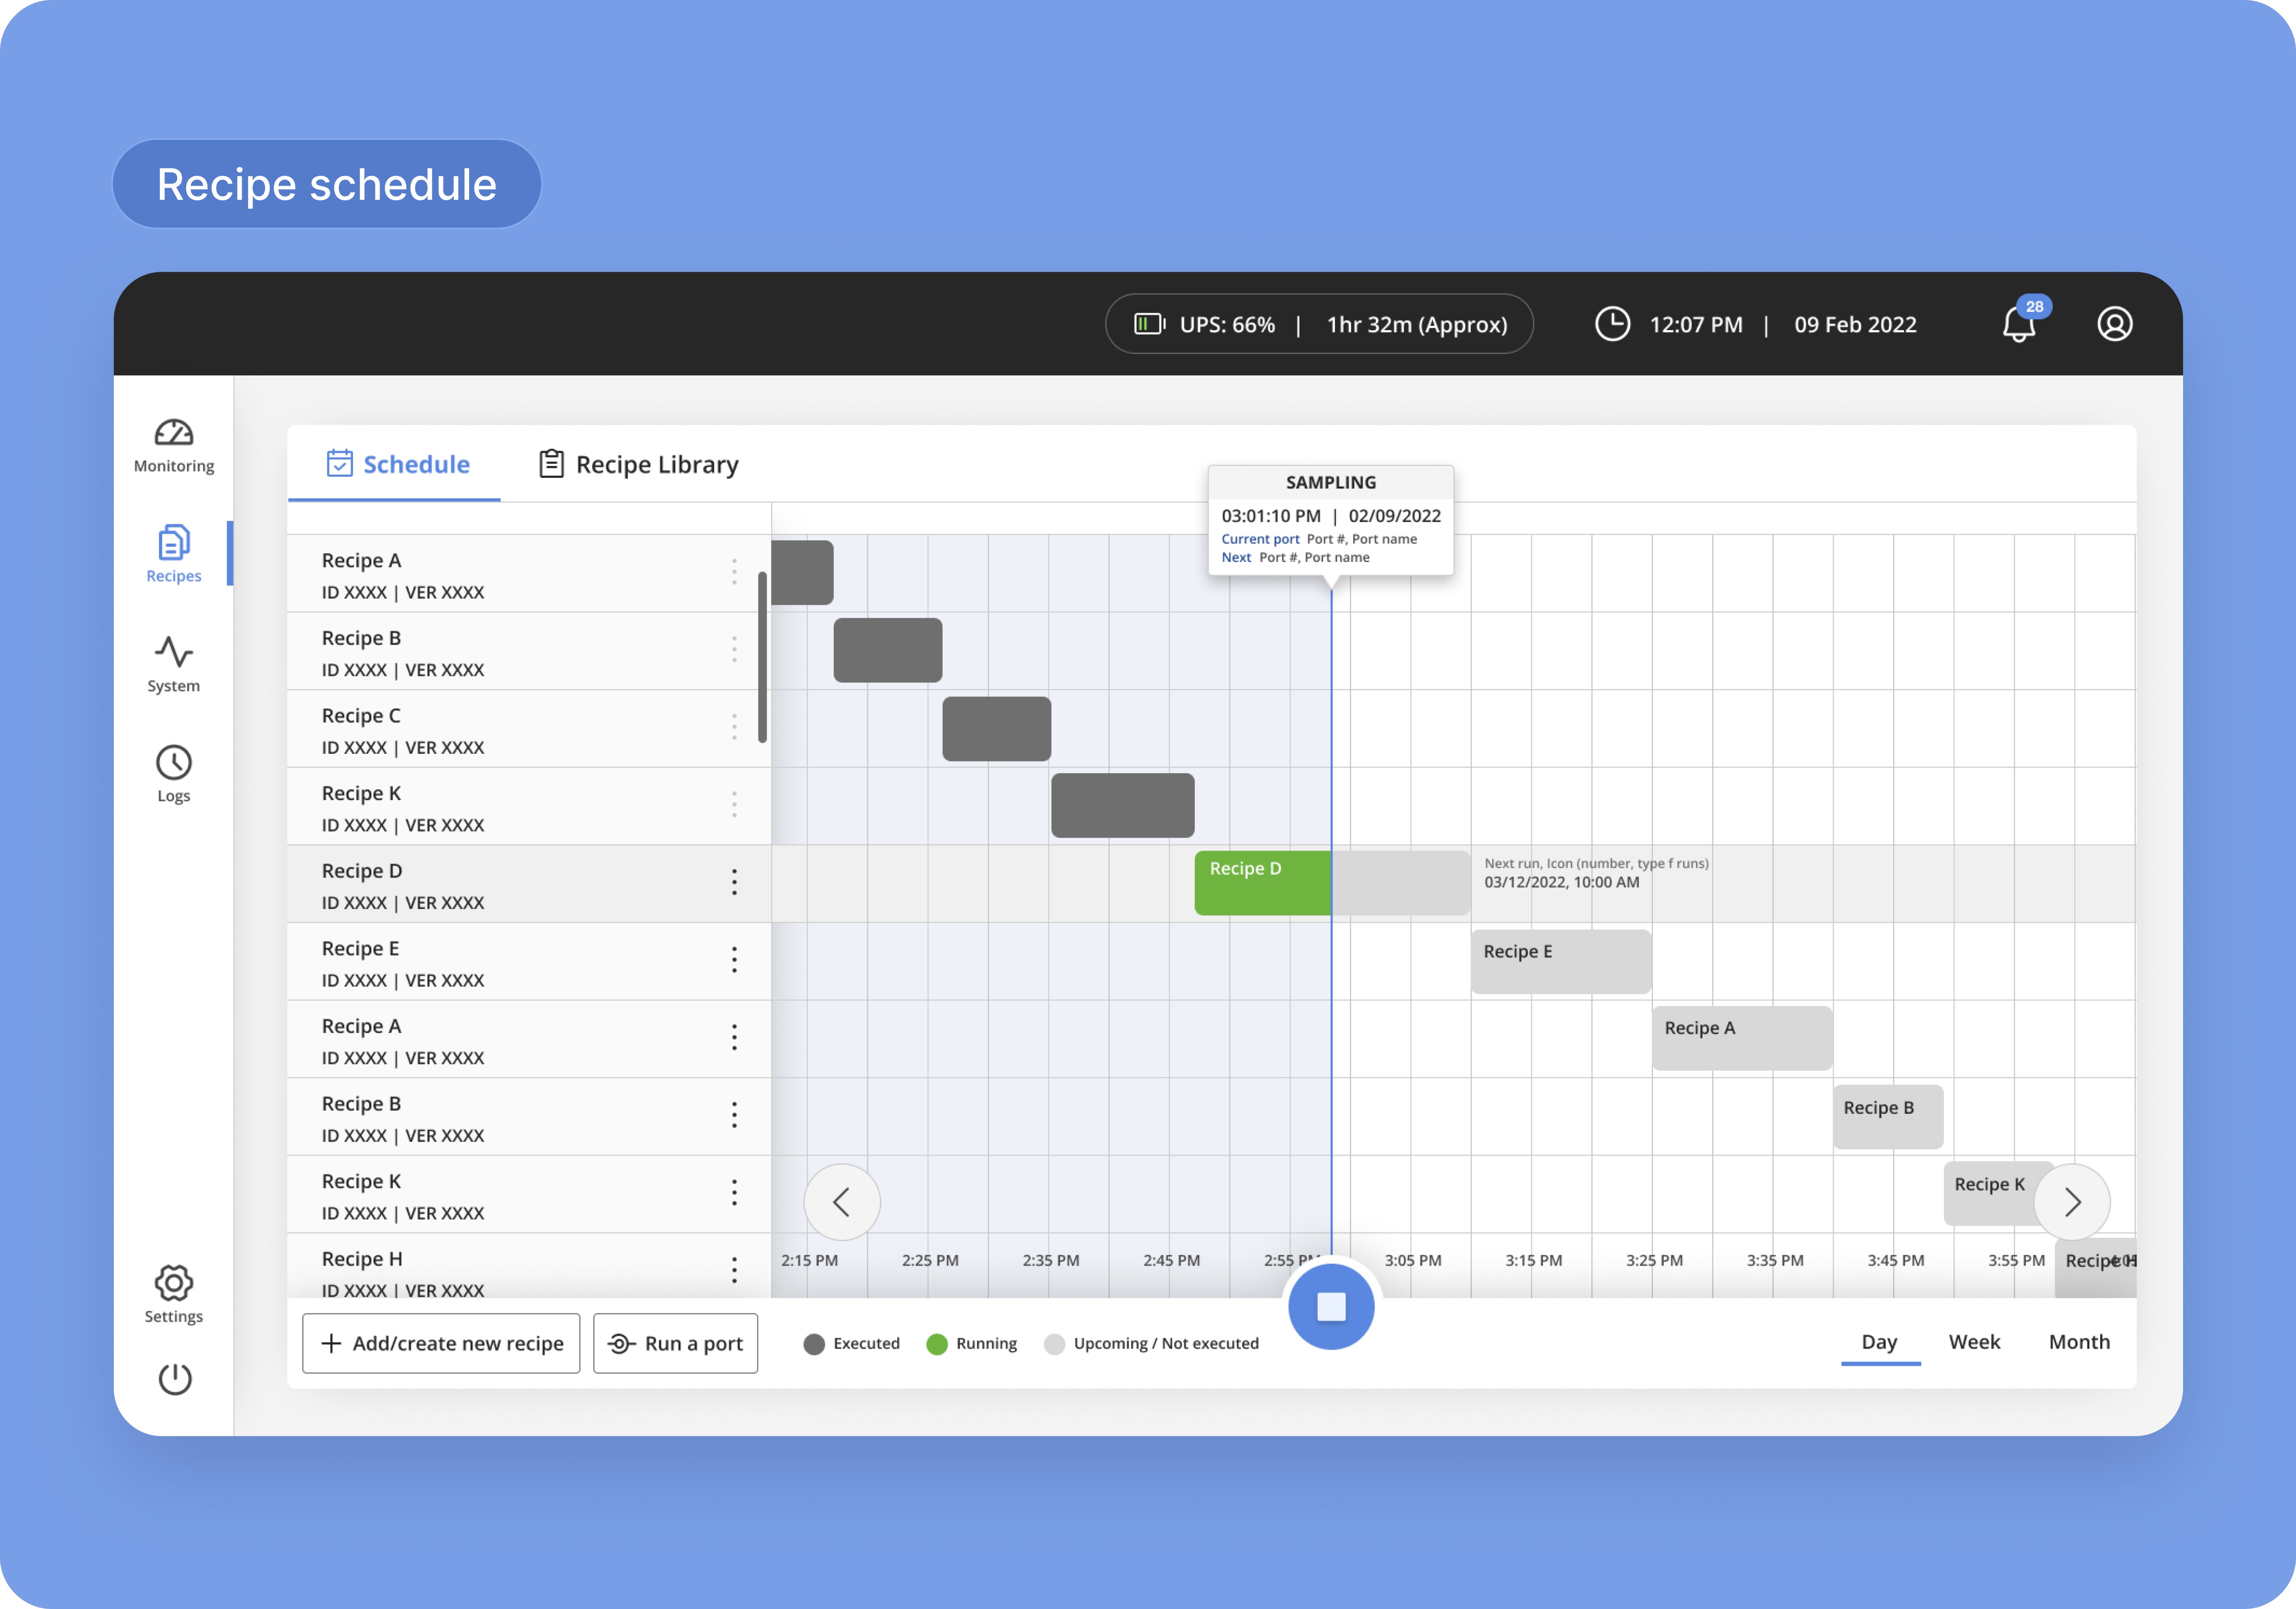
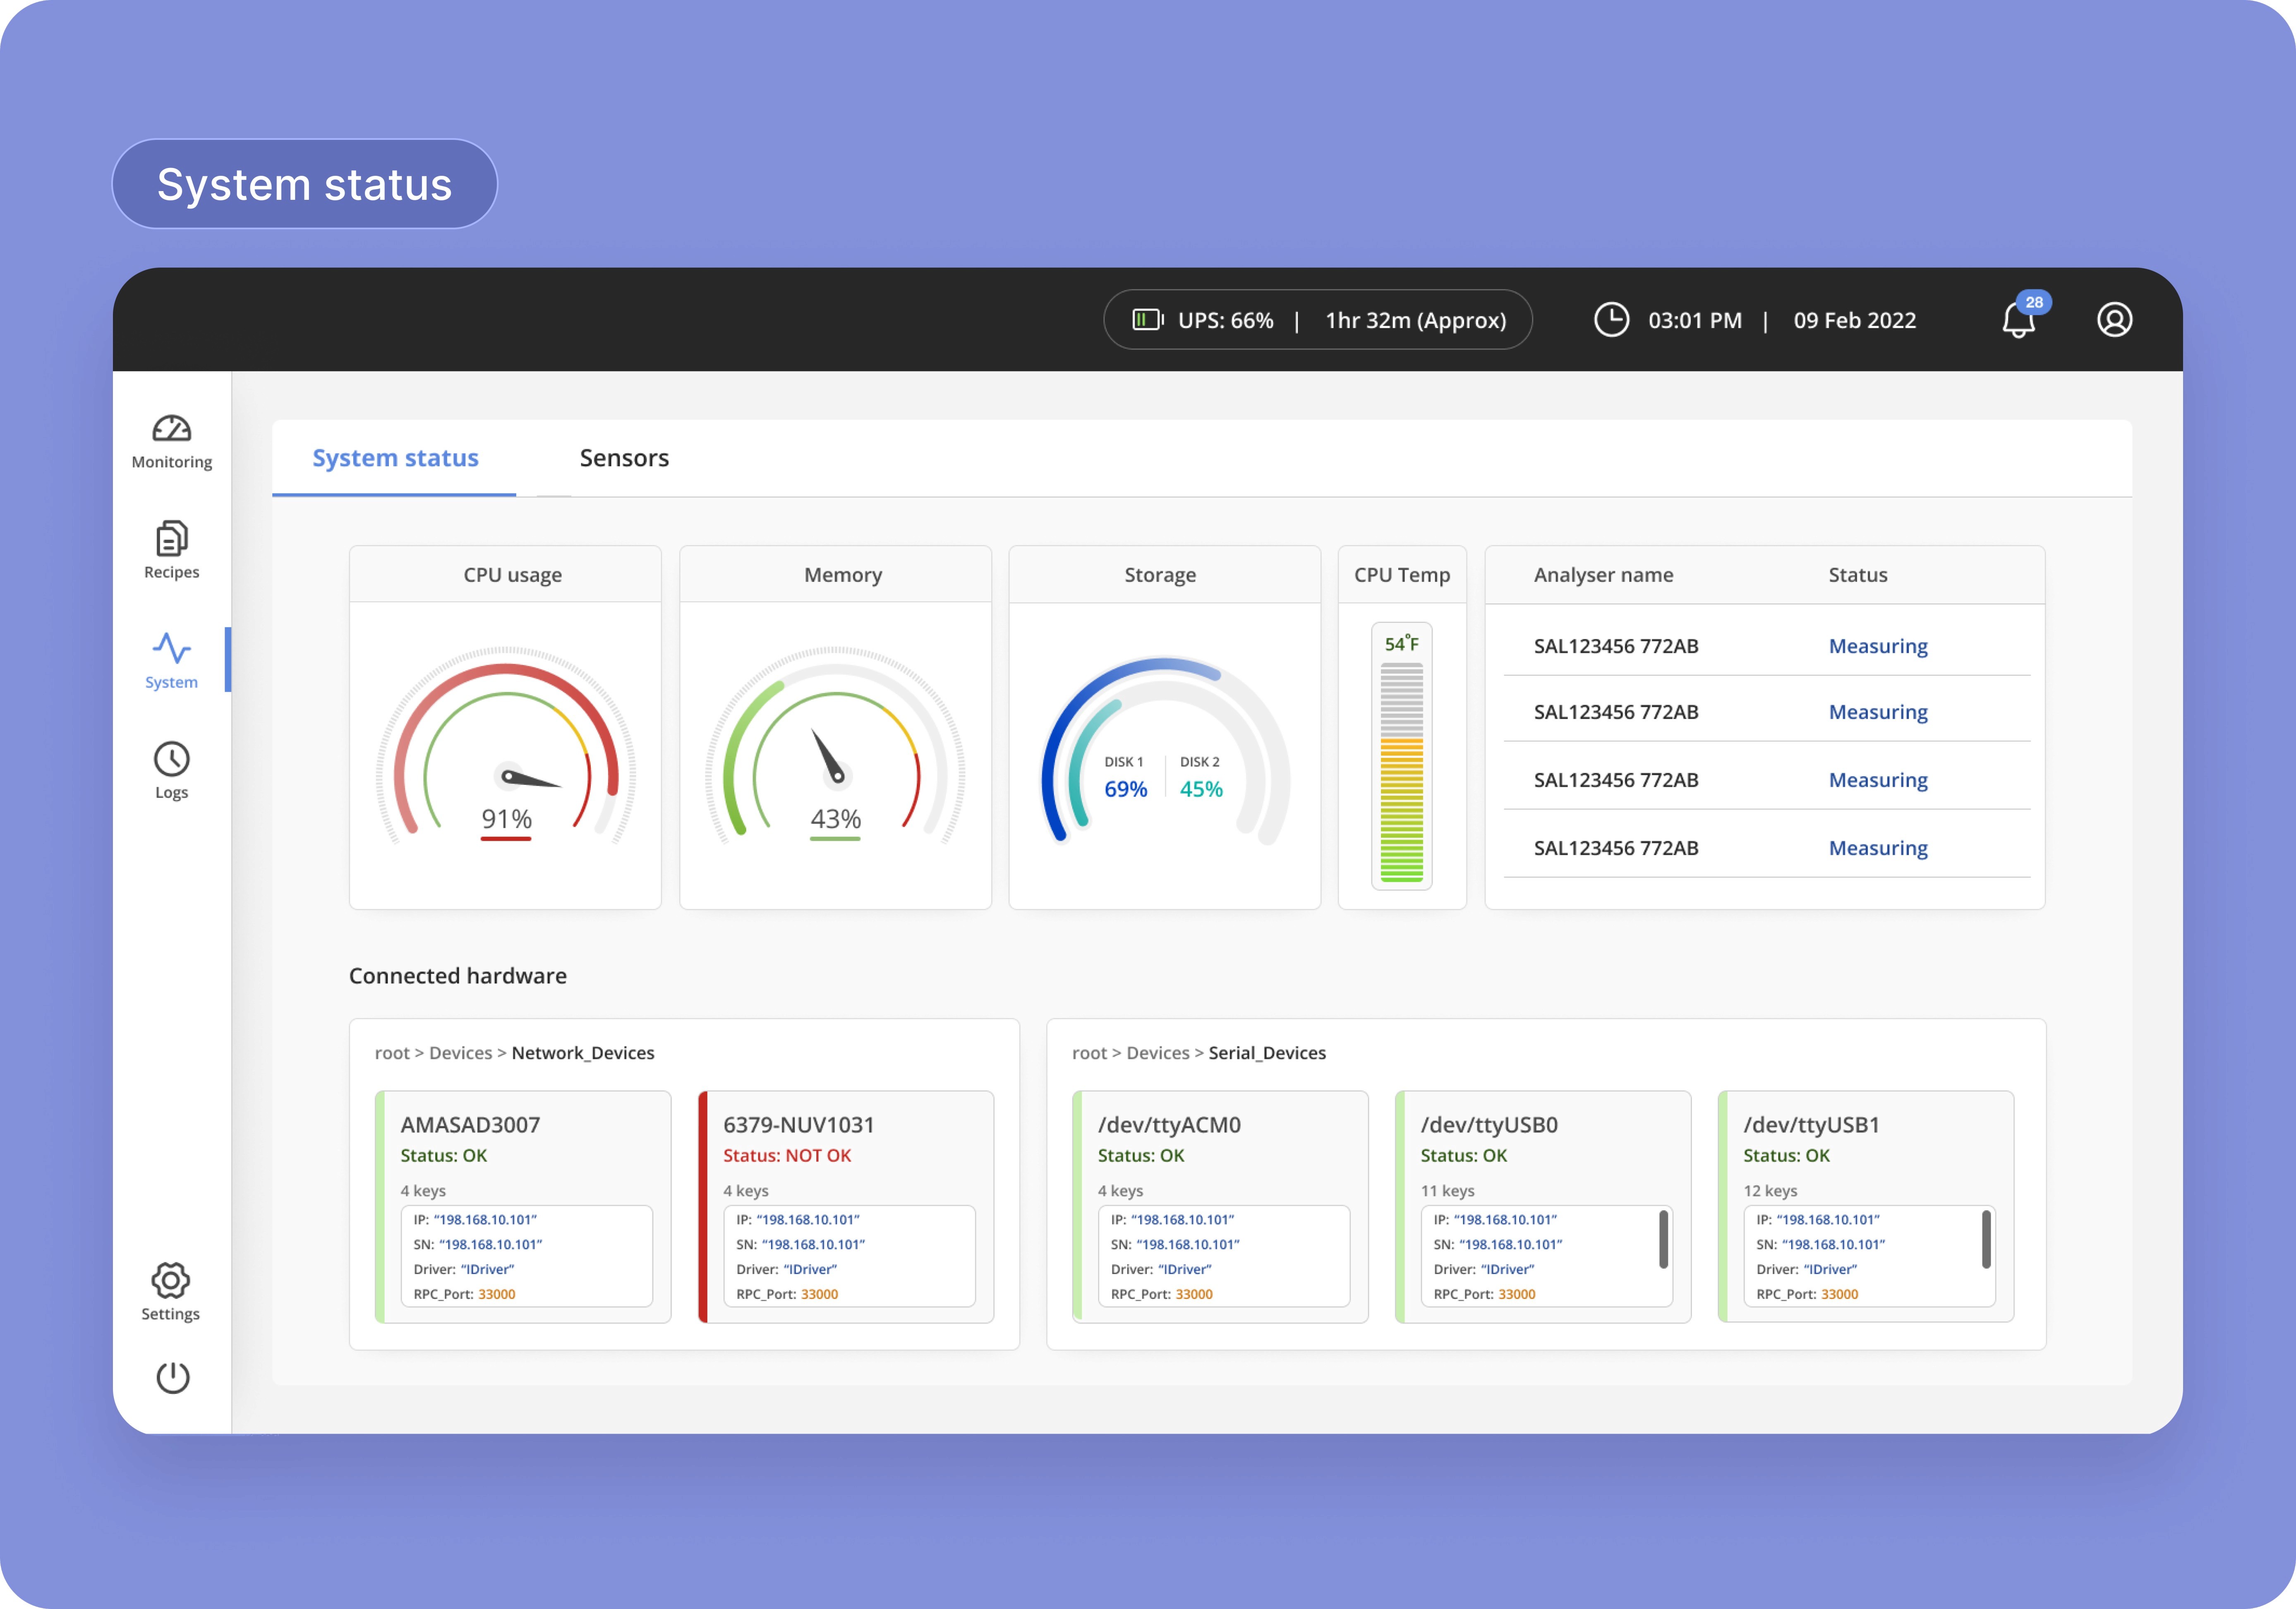
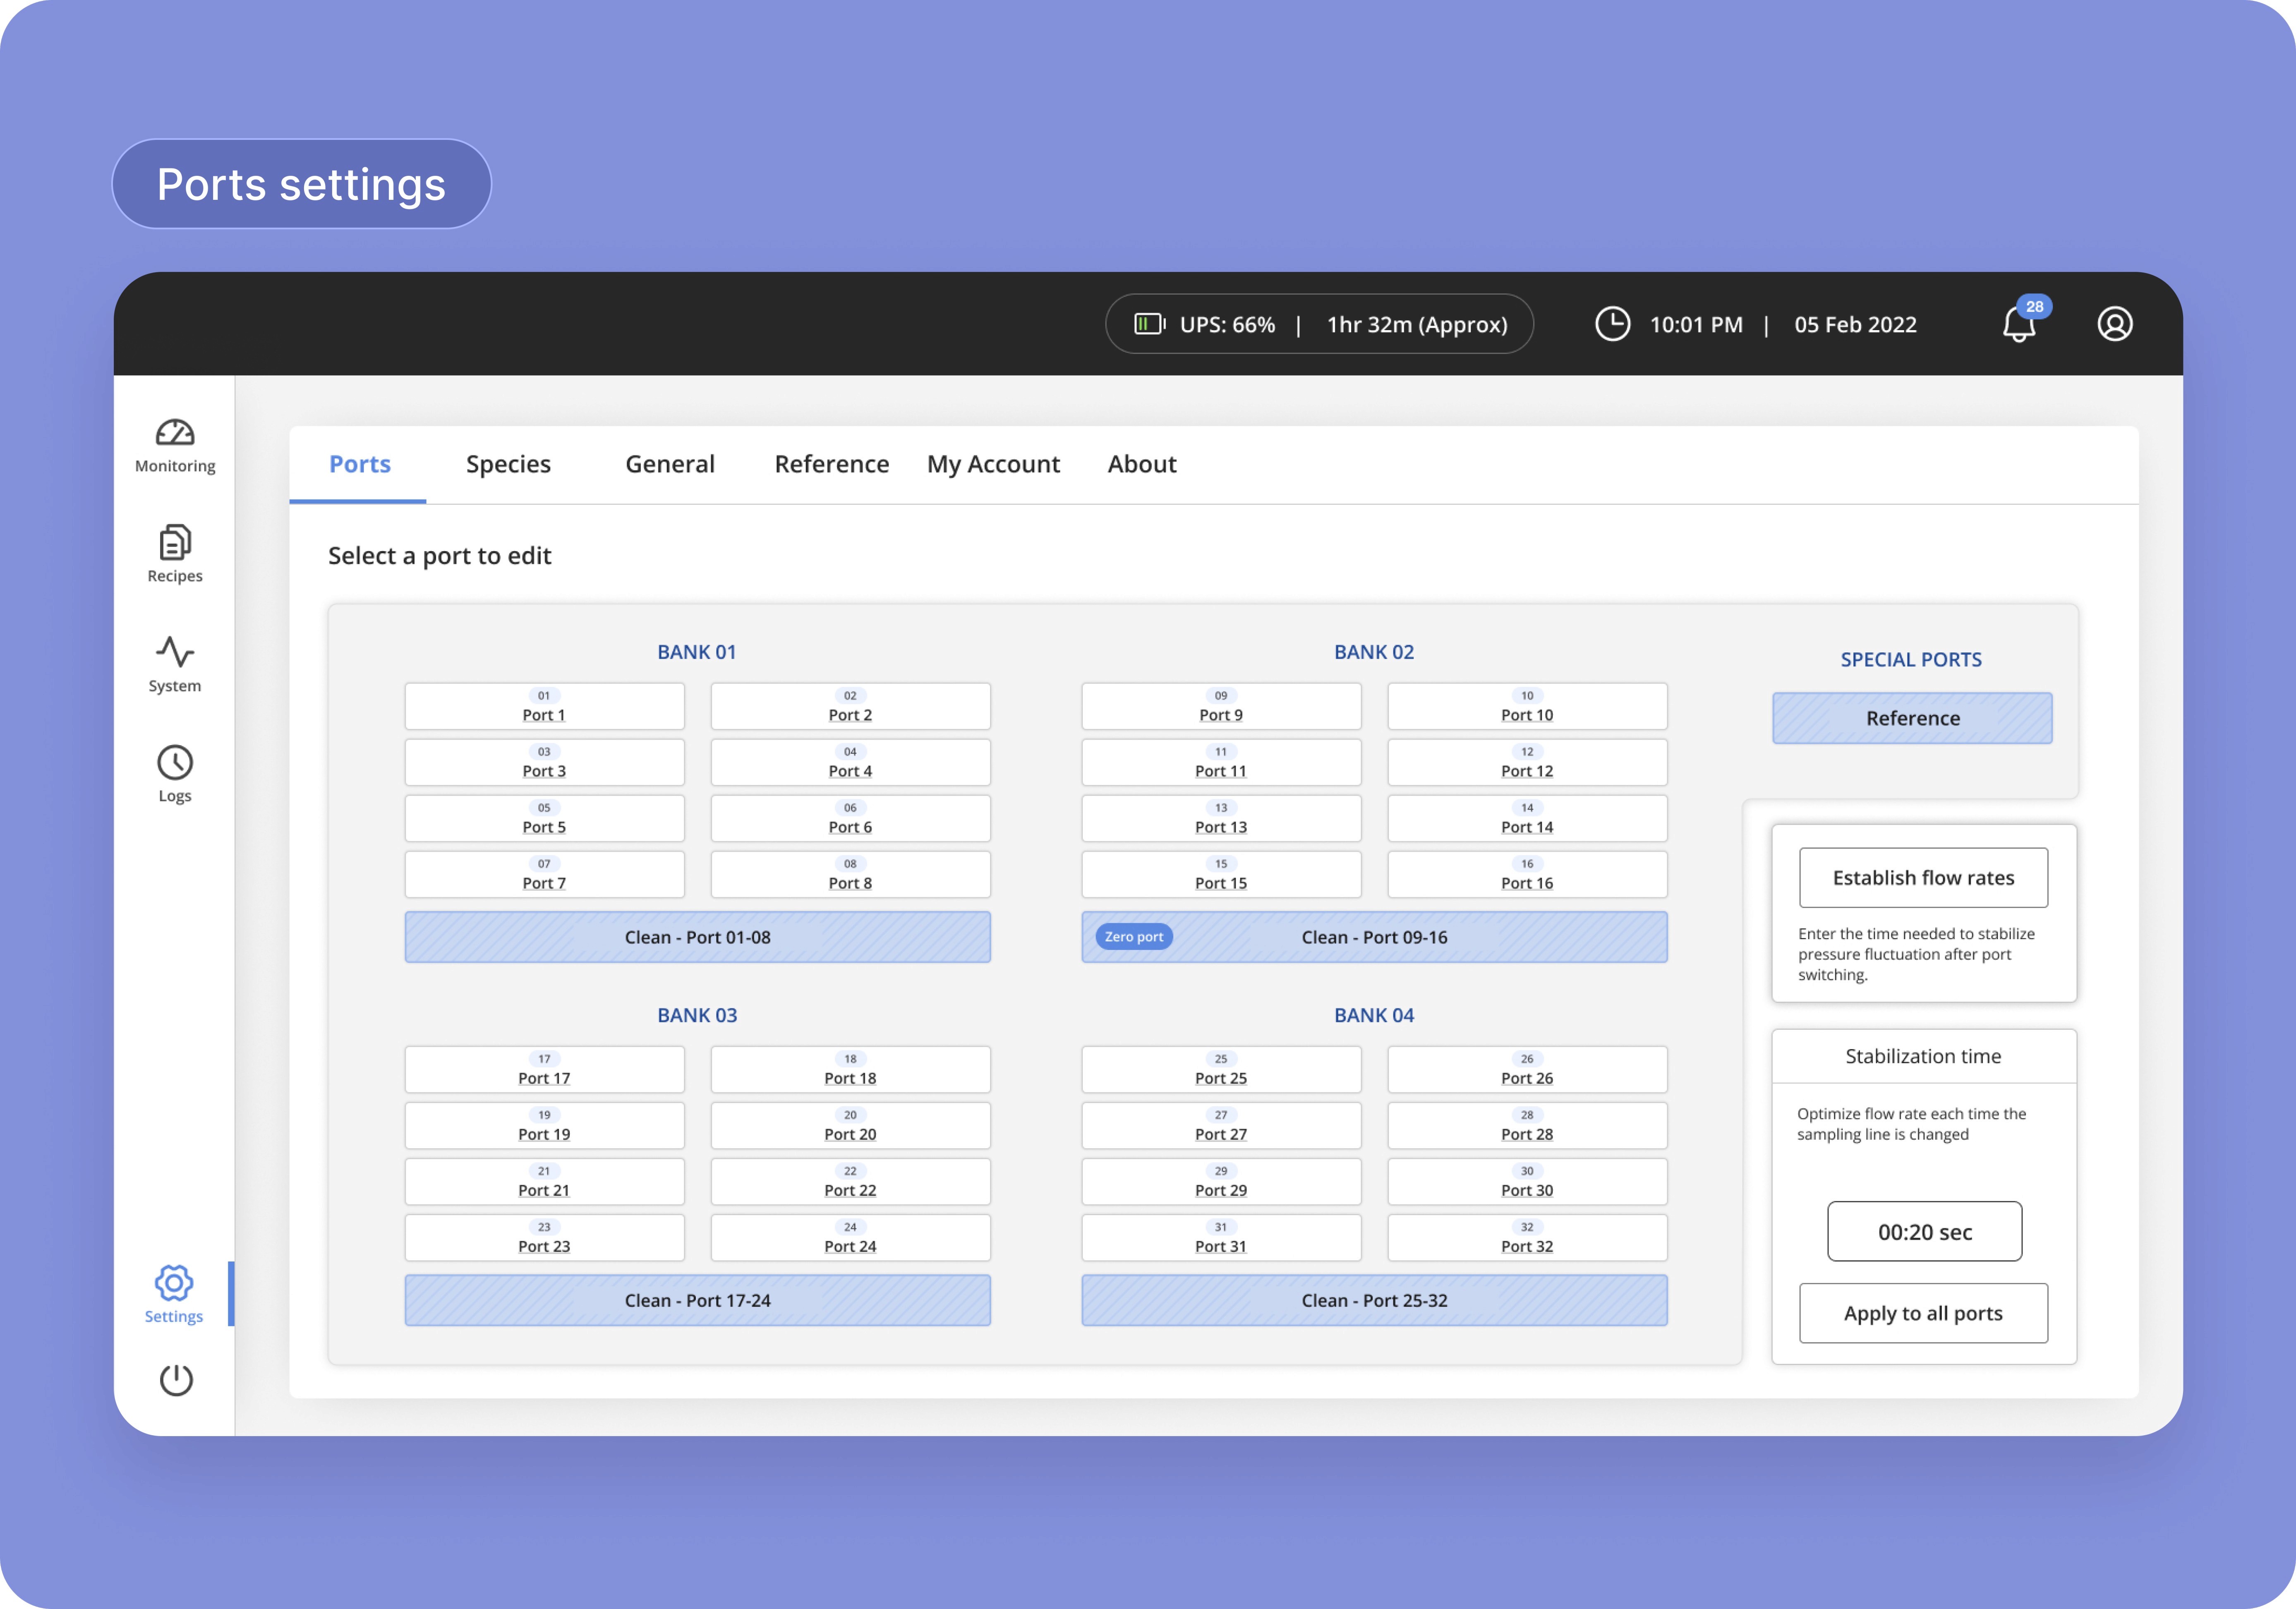
The dashboard facilitates real-time monitoring and analysis of various gases, issuing alerts for areas that need attention. It also empowers users to generate and share reports, along with the ability to continuously run new recipes for measuring gases in different ports.
The dashboard facilitates real-time monitoring and analysis of various gases, issuing alerts for areas that need attention. It also empowers users to generate and share reports, along with the ability to continuously run new recipes for measuring gases in different ports.
The dashboard facilitates real-time monitoring and analysis of various gases, issuing alerts for areas that need attention. It also empowers users to generate and share reports, along with the ability to continuously run new recipes for measuring gases in different ports.
User Impact Goal
User Impact Goal
User Impact Goal
The dashboard facilitates real-time monitoring and analysis of various gases, issuing alerts for areas that need attention. It also empowers users to generate and share reports, along with the ability to continuously run new recipes for measuring gases in different ports.
The dashboard facilitates real-time monitoring and analysis of various gases, issuing alerts for areas that need attention. It also empowers users to generate and share reports, along with the ability to continuously run new recipes for measuring gases in different ports.
The dashboard facilitates real-time monitoring and analysis of various gases, issuing alerts for areas that need attention. It also empowers users to generate and share reports, along with the ability to continuously run new recipes for measuring gases in different ports.
The Problem
The Problem
The Problem
We worked on redesigning the UI for a machine that includes a series of high-precision gas analyzers, mainly utilized to monitor impurities in the semiconductor wafer manufacturing process. The machine is managed and operated via a dashboard UI. Our task was to enhance the UI to make it more user-friendly, both for in-factory use and remote access.
We worked on redesigning the UI for a machine that includes a series of high-precision gas analyzers, mainly utilized to monitor impurities in the semiconductor wafer manufacturing process. The machine is managed and operated via a dashboard UI. Our task was to enhance the UI to make it more user-friendly, both for in-factory use and remote access.
We worked on redesigning the UI for a machine that includes a series of high-precision gas analyzers, mainly utilized to monitor impurities in the semiconductor wafer manufacturing process. The machine is managed and operated via a dashboard UI. Our task was to enhance the UI to make it more user-friendly, both for in-factory use and remote access.
Design Process
Design Process
Design Process
We worked on redesigning the UI for a machine that includes a series of high-precision gas analyzers, mainly utilized to monitor impurities in the semiconductor wafer manufacturing process. The machine is managed and operated via a dashboard UI. Our task was to enhance the UI to make it more user-friendly, both for in-factory use and remote access.
We worked on redesigning the UI for a machine that includes a series of high-precision gas analyzers, mainly utilized to monitor impurities in the semiconductor wafer manufacturing process. The machine is managed and operated via a dashboard UI. Our task was to enhance the UI to make it more user-friendly, both for in-factory use and remote access.
We worked on redesigning the UI for a machine that includes a series of high-precision gas analyzers, mainly utilized to monitor impurities in the semiconductor wafer manufacturing process. The machine is managed and operated via a dashboard UI. Our task was to enhance the UI to make it more user-friendly, both for in-factory use and remote access.
01/ Research & Ideation
01/ Research & Ideation
01/ Research & Ideation
The dashboard facilitates real-time monitoring and analysis of various gases, issuing alerts for areas that need attention. It also empowers users to generate and share reports, along with the ability to continuously run new recipes for measuring gases in different ports.
The dashboard facilitates real-time monitoring and analysis of various gases, issuing alerts for areas that need attention. It also empowers users to generate and share reports, along with the ability to continuously run new recipes for measuring gases in different ports.
The dashboard facilitates real-time monitoring and analysis of various gases, issuing alerts for areas that need attention. It also empowers users to generate and share reports, along with the ability to continuously run new recipes for measuring gases in different ports.
02/ Flow Mappingpact Goal
02/ Flow Mappingpact Goal
02/ Flow Mappingpact Goal
The dashboard facilitates real-time monitoring and analysis of various gases, issuing alerts for areas that need attention. It also empowers users to generate and share reports, along with the ability to continuously run new recipes for measuring gases in different ports.
The dashboard facilitates real-time monitoring and analysis of various gases, issuing alerts for areas that need attention. It also empowers users to generate and share reports, along with the ability to continuously run new recipes for measuring gases in different ports.
The dashboard facilitates real-time monitoring and analysis of various gases, issuing alerts for areas that need attention. It also empowers users to generate and share reports, along with the ability to continuously run new recipes for measuring gases in different ports.
03/ Functional Specification & Wireframes
03/ Functional Specification & Wireframes
03/ Functional Specification & Wireframes
The dashboard facilitates real-time monitoring and analysis of various gases, issuing alerts for areas that need attention. It also empowers users to generate and share reports, along with the ability to continuously run new recipes for measuring gases in different ports.
The dashboard facilitates real-time monitoring and analysis of various gases, issuing alerts for areas that need attention. It also empowers users to generate and share reports, along with the ability to continuously run new recipes for measuring gases in different ports.
The dashboard facilitates real-time monitoring and analysis of various gases, issuing alerts for areas that need attention. It also empowers users to generate and share reports, along with the ability to continuously run new recipes for measuring gases in different ports.
04/ Concept Designs
04/ Concept Designs
04/ Concept Designs
The dashboard facilitates real-time monitoring and analysis of various gases, issuing alerts for areas that need attention. It also empowers users to generate and share reports, along with the ability to continuously run new recipes for measuring gases in different ports.
The dashboard facilitates real-time monitoring and analysis of various gases, issuing alerts for areas that need attention. It also empowers users to generate and share reports, along with the ability to continuously run new recipes for measuring gases in different ports.
The dashboard facilitates real-time monitoring and analysis of various gases, issuing alerts for areas that need attention. It also empowers users to generate and share reports, along with the ability to continuously run new recipes for measuring gases in different ports.
Key screens
Key screens
The challenge: Untangling complexity
The challenge: Untangling complexity
The challenge: Untangling complexity
The existing dashboard UI presented challenges such as convoluted workflows and usability issues, resulting in difficulties for users to complete their regular tasks efficiently. The UI also lacked error prevention measures and was challenging to comprehend. At Designit, our team identified opportunities to enhance the UX for a more comprehensive, user-centric, and streamlined experience.
The existing dashboard UI presented challenges such as convoluted workflows and usability issues, resulting in difficulties for users to complete their regular tasks efficiently. The UI also lacked error prevention measures and was challenging to comprehend. At Designit, our team identified opportunities to enhance the UX for a more comprehensive, user-centric, and streamlined experience.
The existing dashboard UI presented challenges such as convoluted workflows and usability issues, resulting in difficulties for users to complete their regular tasks efficiently. The UI also lacked error prevention measures and was challenging to comprehend. At Designit, our team identified opportunities to enhance the UX for a more comprehensive, user-centric, and streamlined experience.
My role
My role
My role
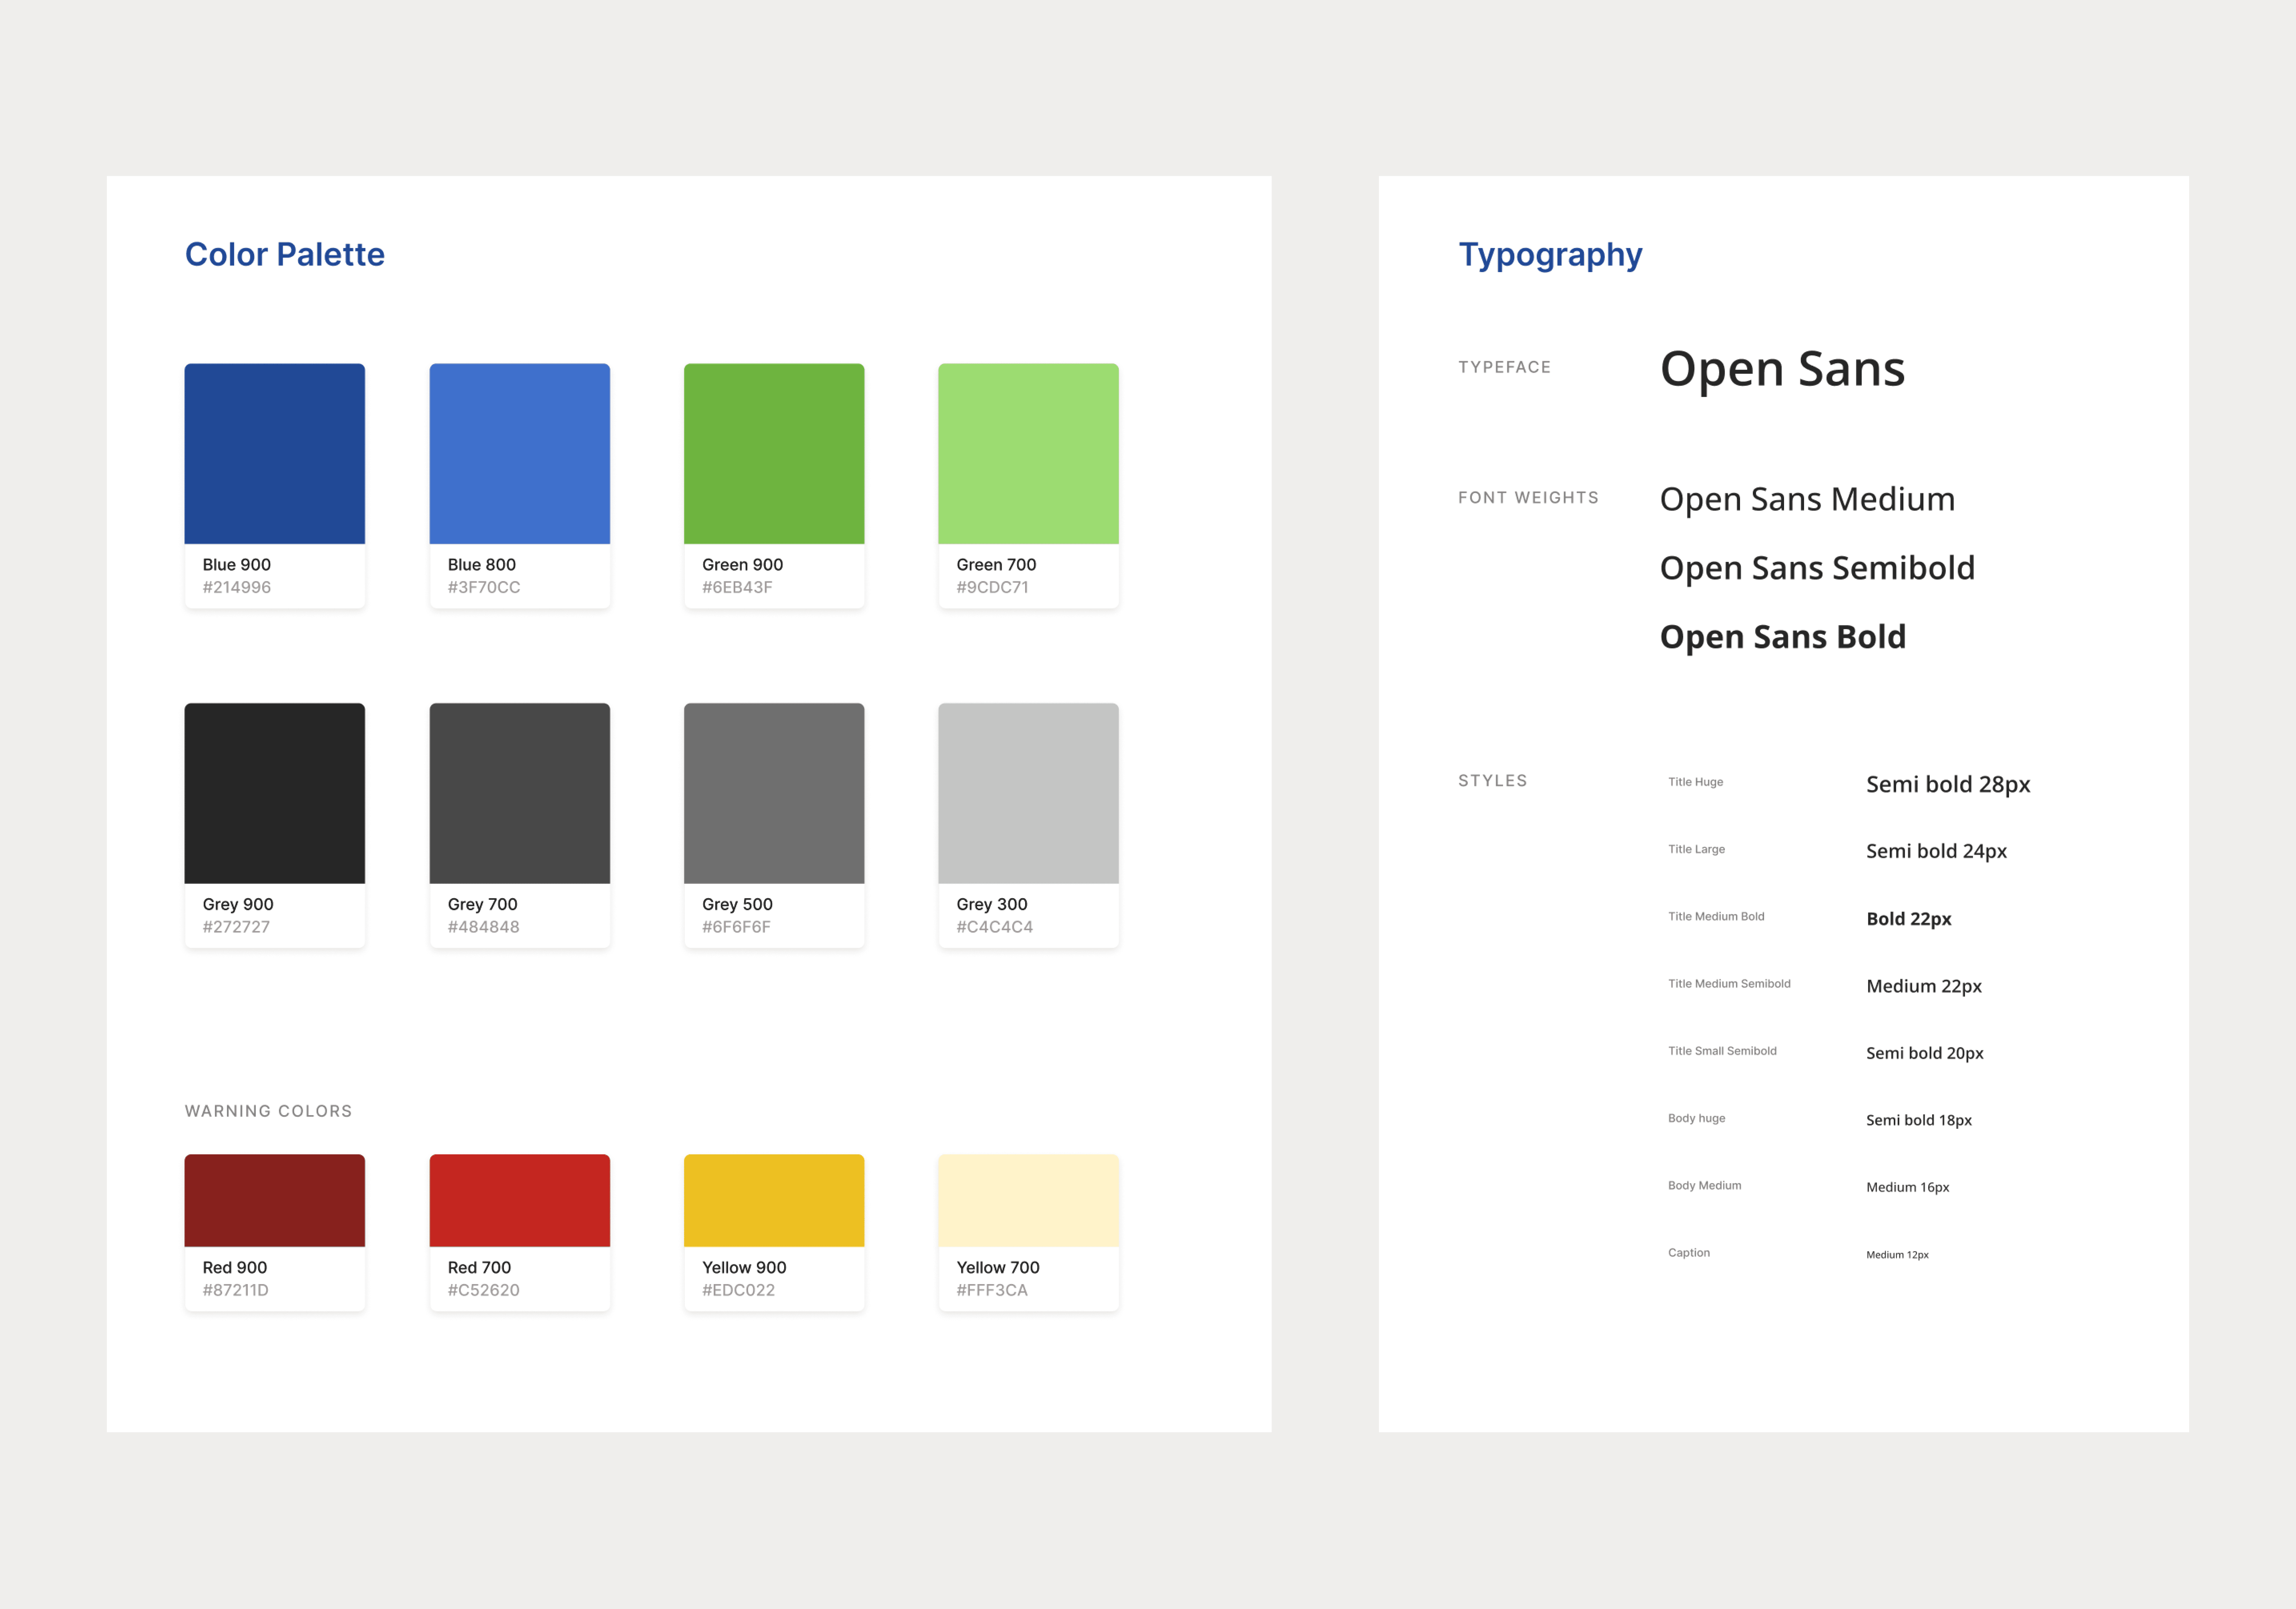
In the project, I converted the wireframes into high-fidelity prototypes, adapting the information-dense UI for touch responsiveness across various devices. Our team crafted a responsive UI vision using moodboards, style guides, and visual explorations. Following that, we designed the high-fidelity UI, ensuring a seamless handoff to developers through meticulous asset production and organization. Collaborating with a senior designer, we organized stakeholder meetings and co-design workshops to identify significant challenges in the monitoring and analysis section of the dashboard.
In the project, I converted the wireframes into high-fidelity prototypes, adapting the information-dense UI for touch responsiveness across various devices. Our team crafted a responsive UI vision using moodboards, style guides, and visual explorations. Following that, we designed the high-fidelity UI, ensuring a seamless handoff to developers through meticulous asset production and organization. Collaborating with a senior designer, we organized stakeholder meetings and co-design workshops to identify significant challenges in the monitoring and analysis section of the dashboard.
In the project, I converted the wireframes into high-fidelity prototypes, adapting the information-dense UI for touch responsiveness across various devices. Our team crafted a responsive UI vision using moodboards, style guides, and visual explorations. Following that, we designed the high-fidelity UI, ensuring a seamless handoff to developers through meticulous asset production and organization. Collaborating with a senior designer, we organized stakeholder meetings and co-design workshops to identify significant challenges in the monitoring and analysis section of the dashboard.
Key screens
Key screens
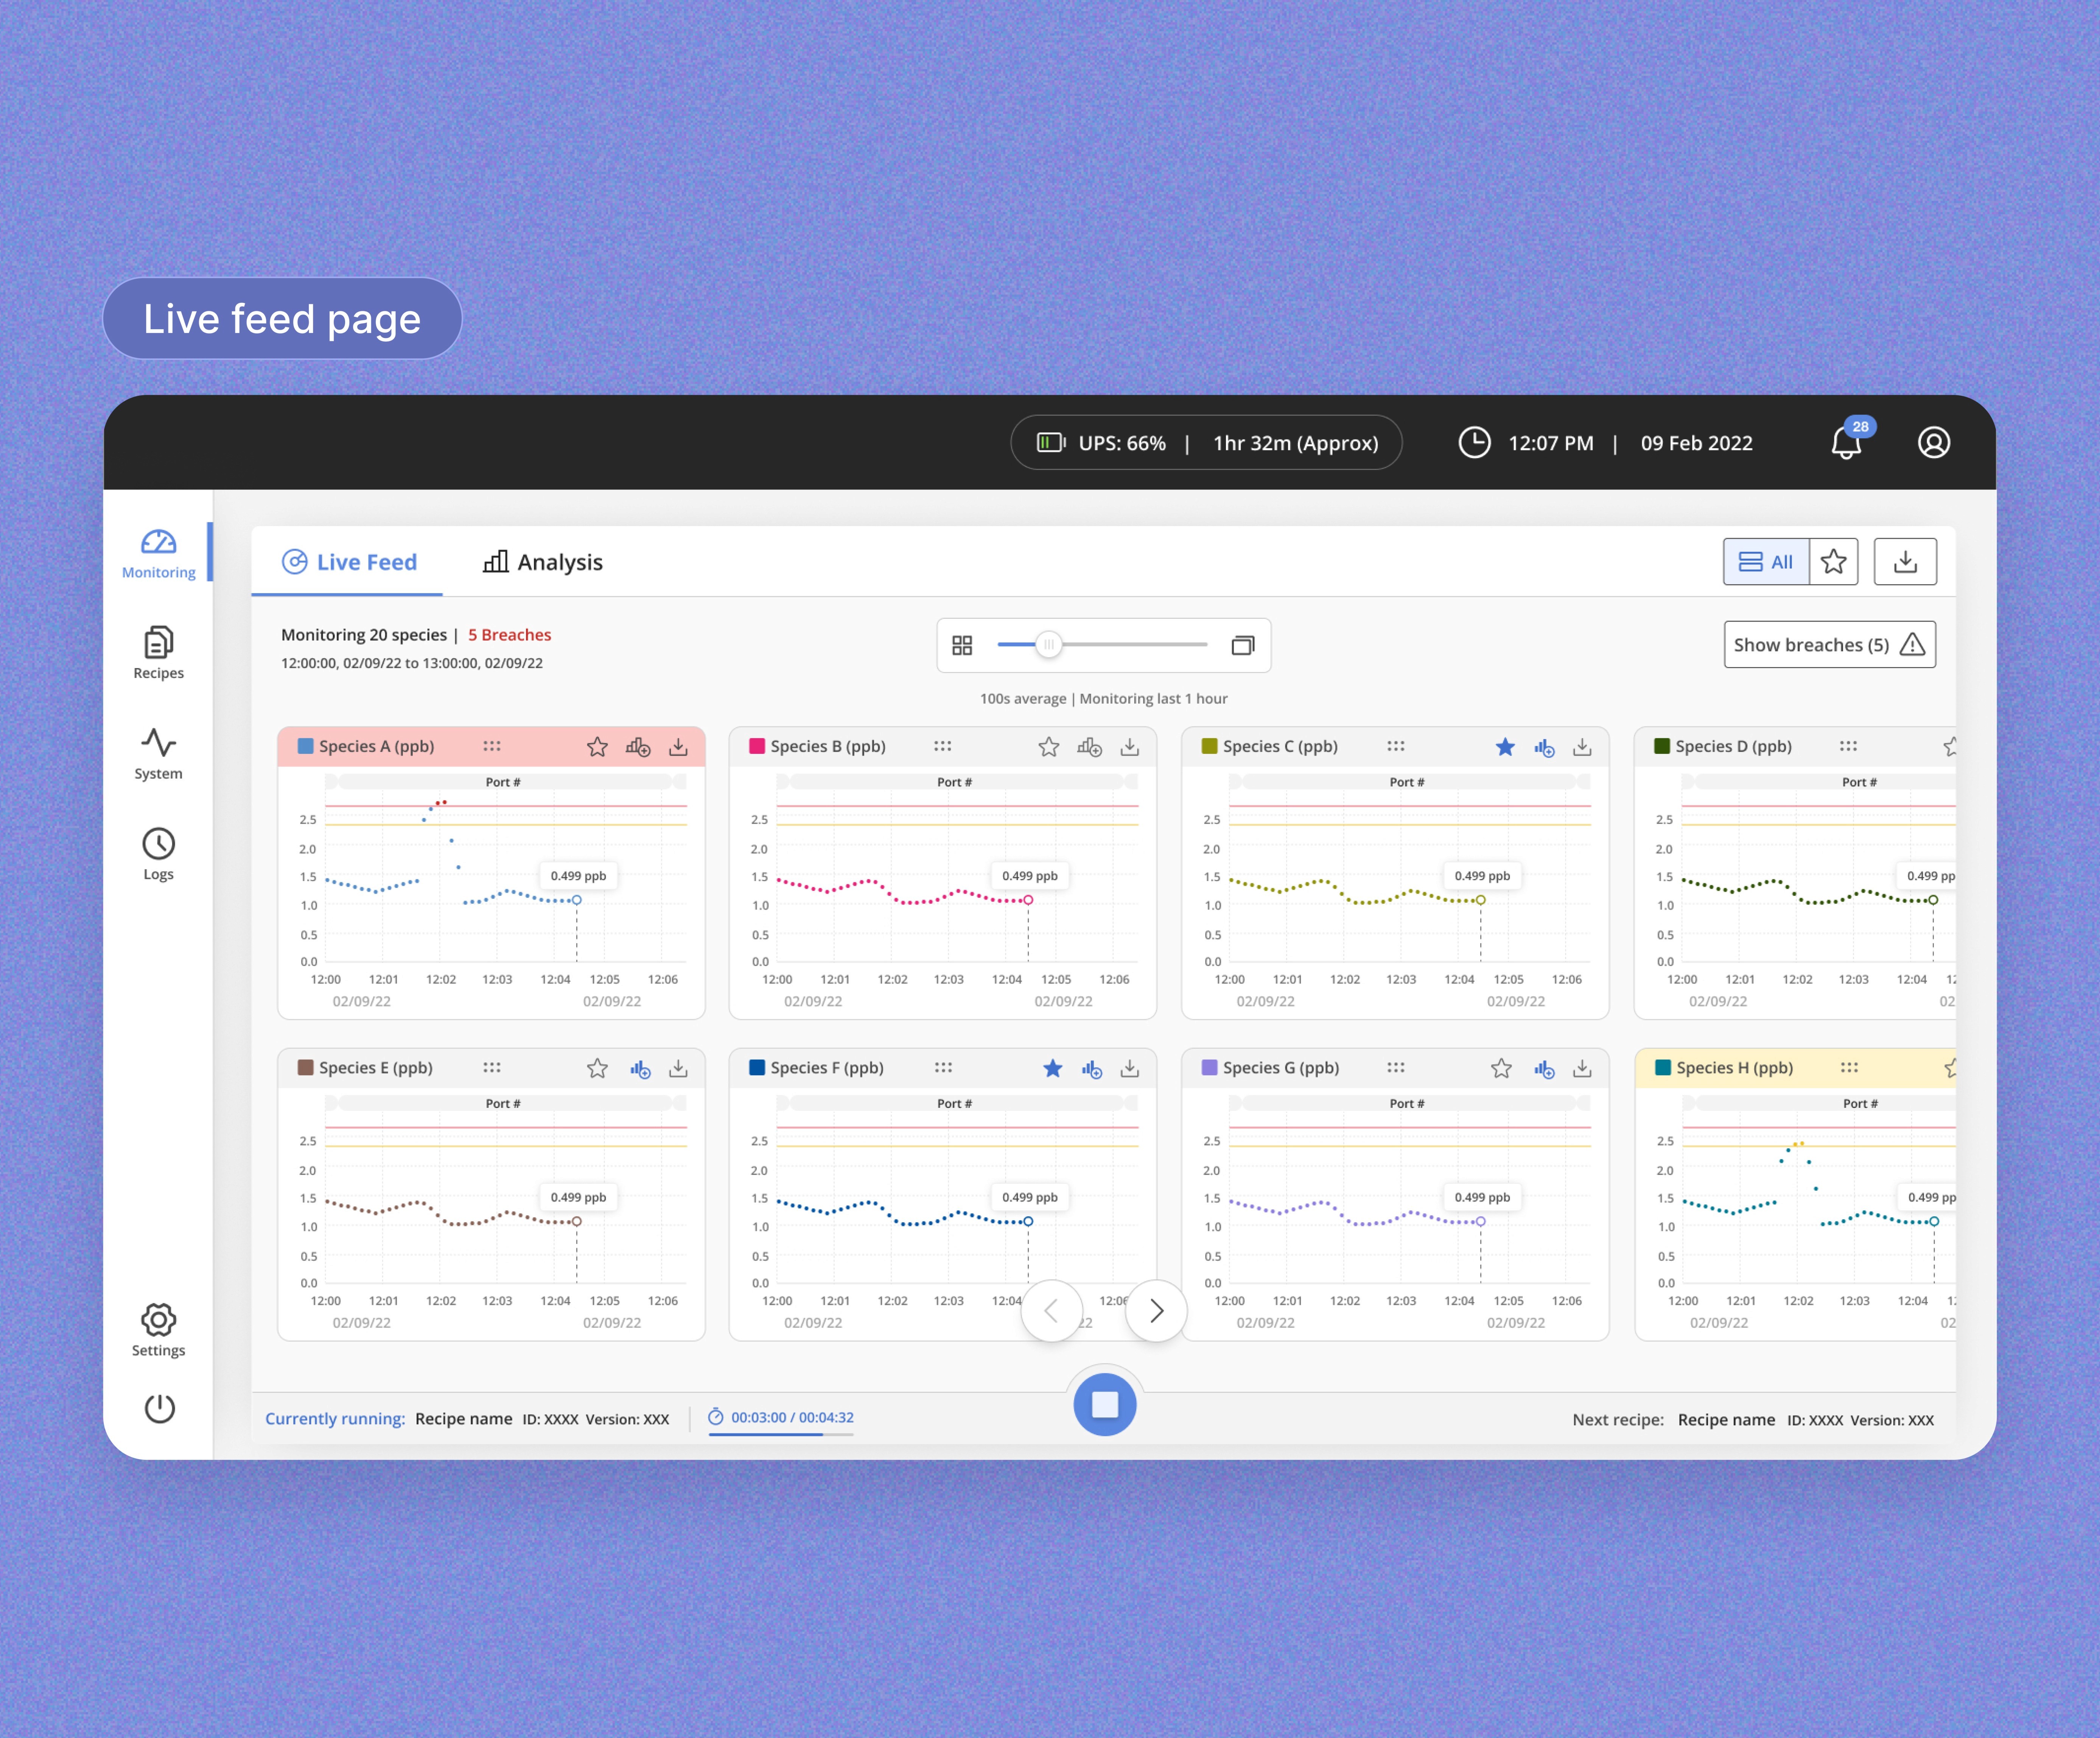
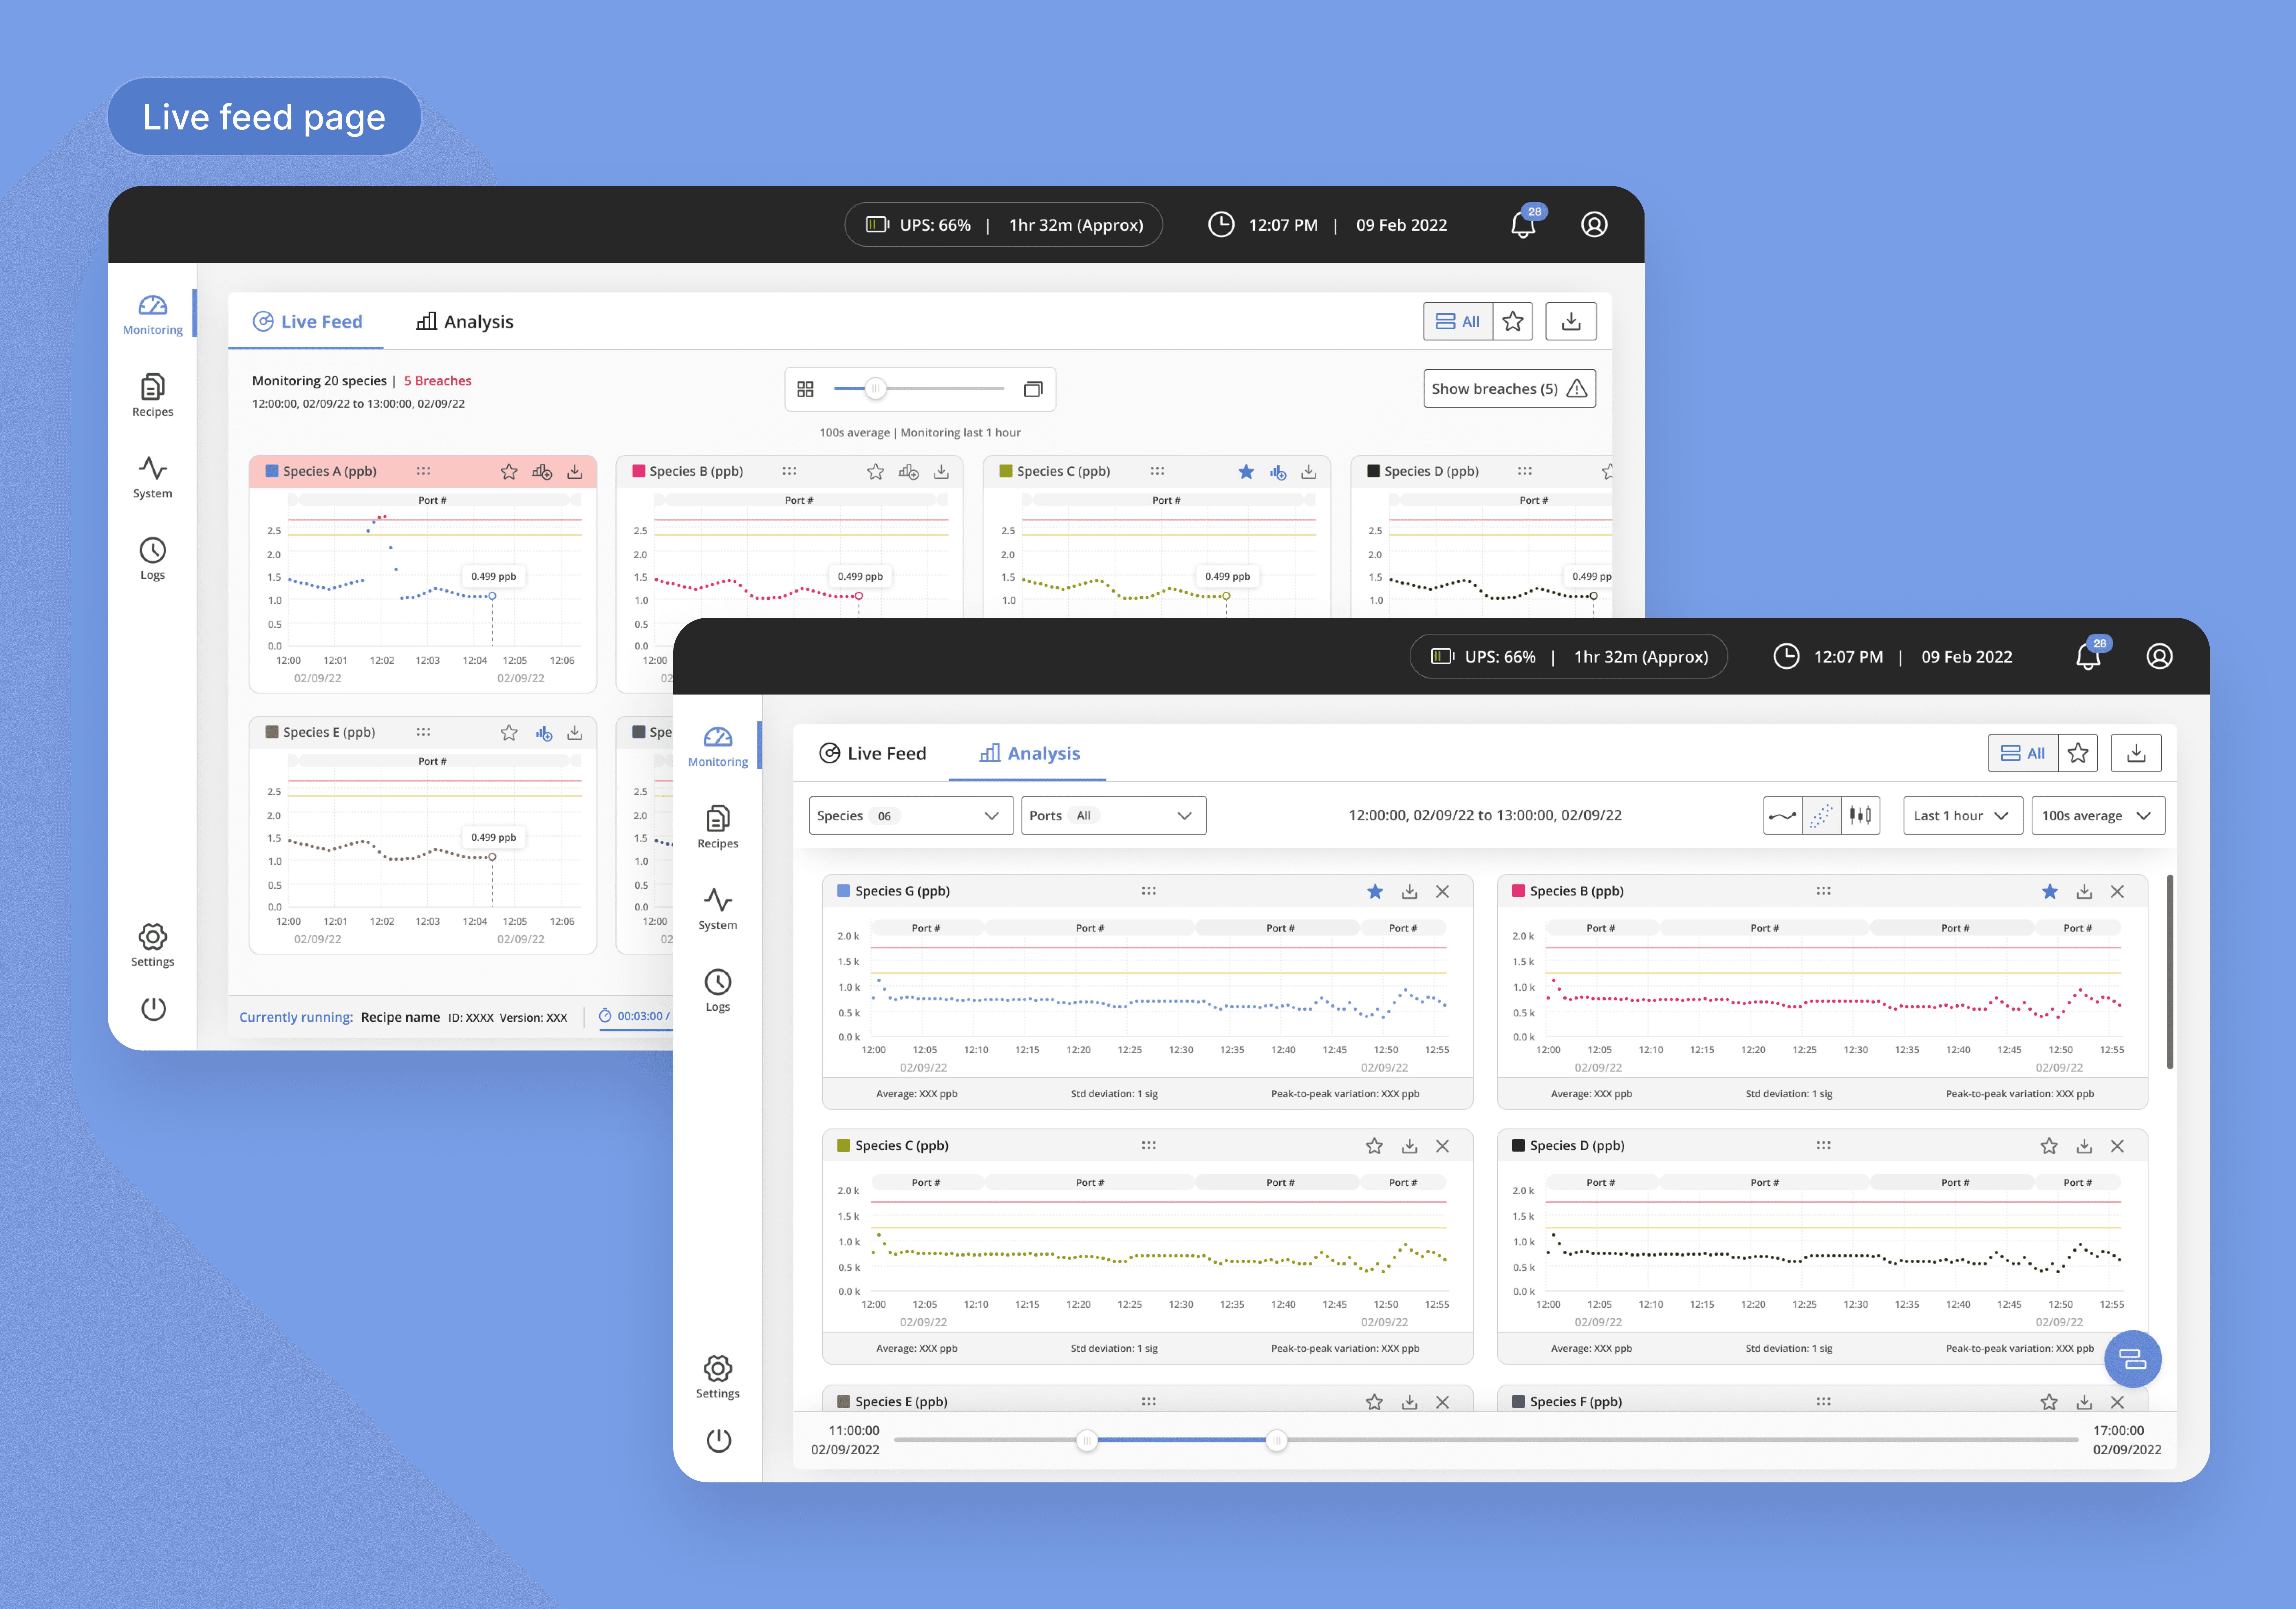
Untangling complexity
Untangling complexity
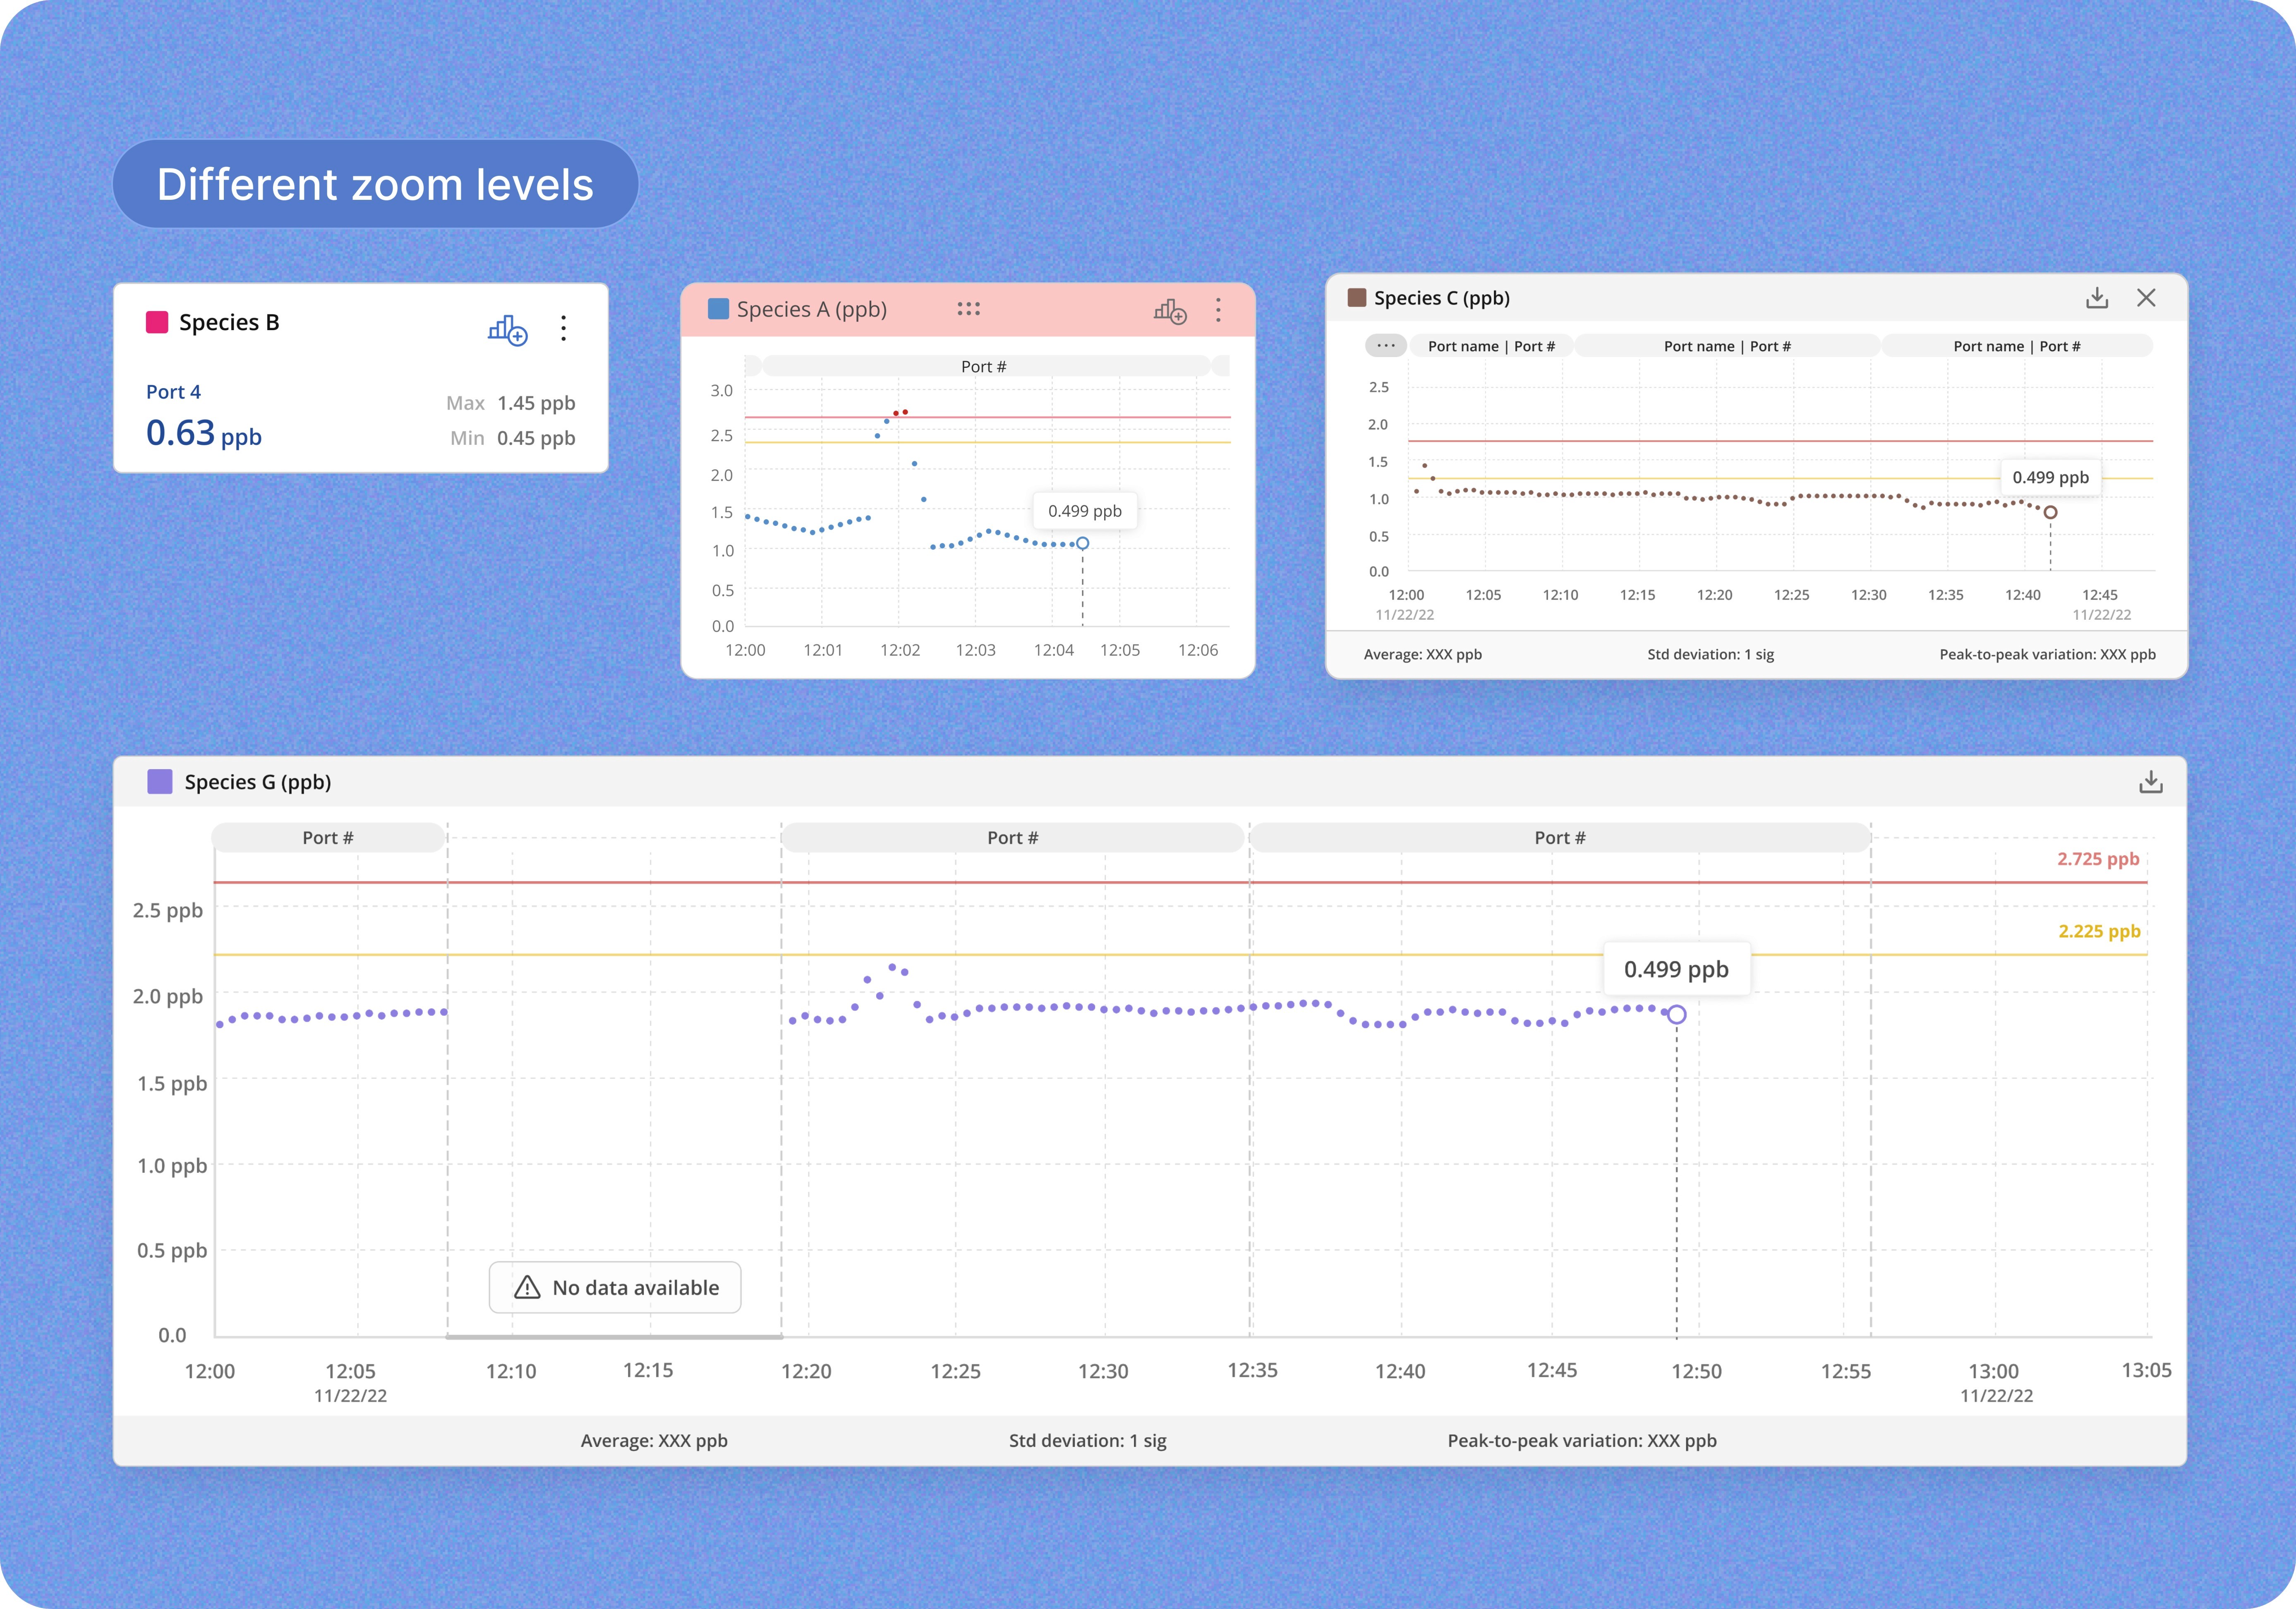
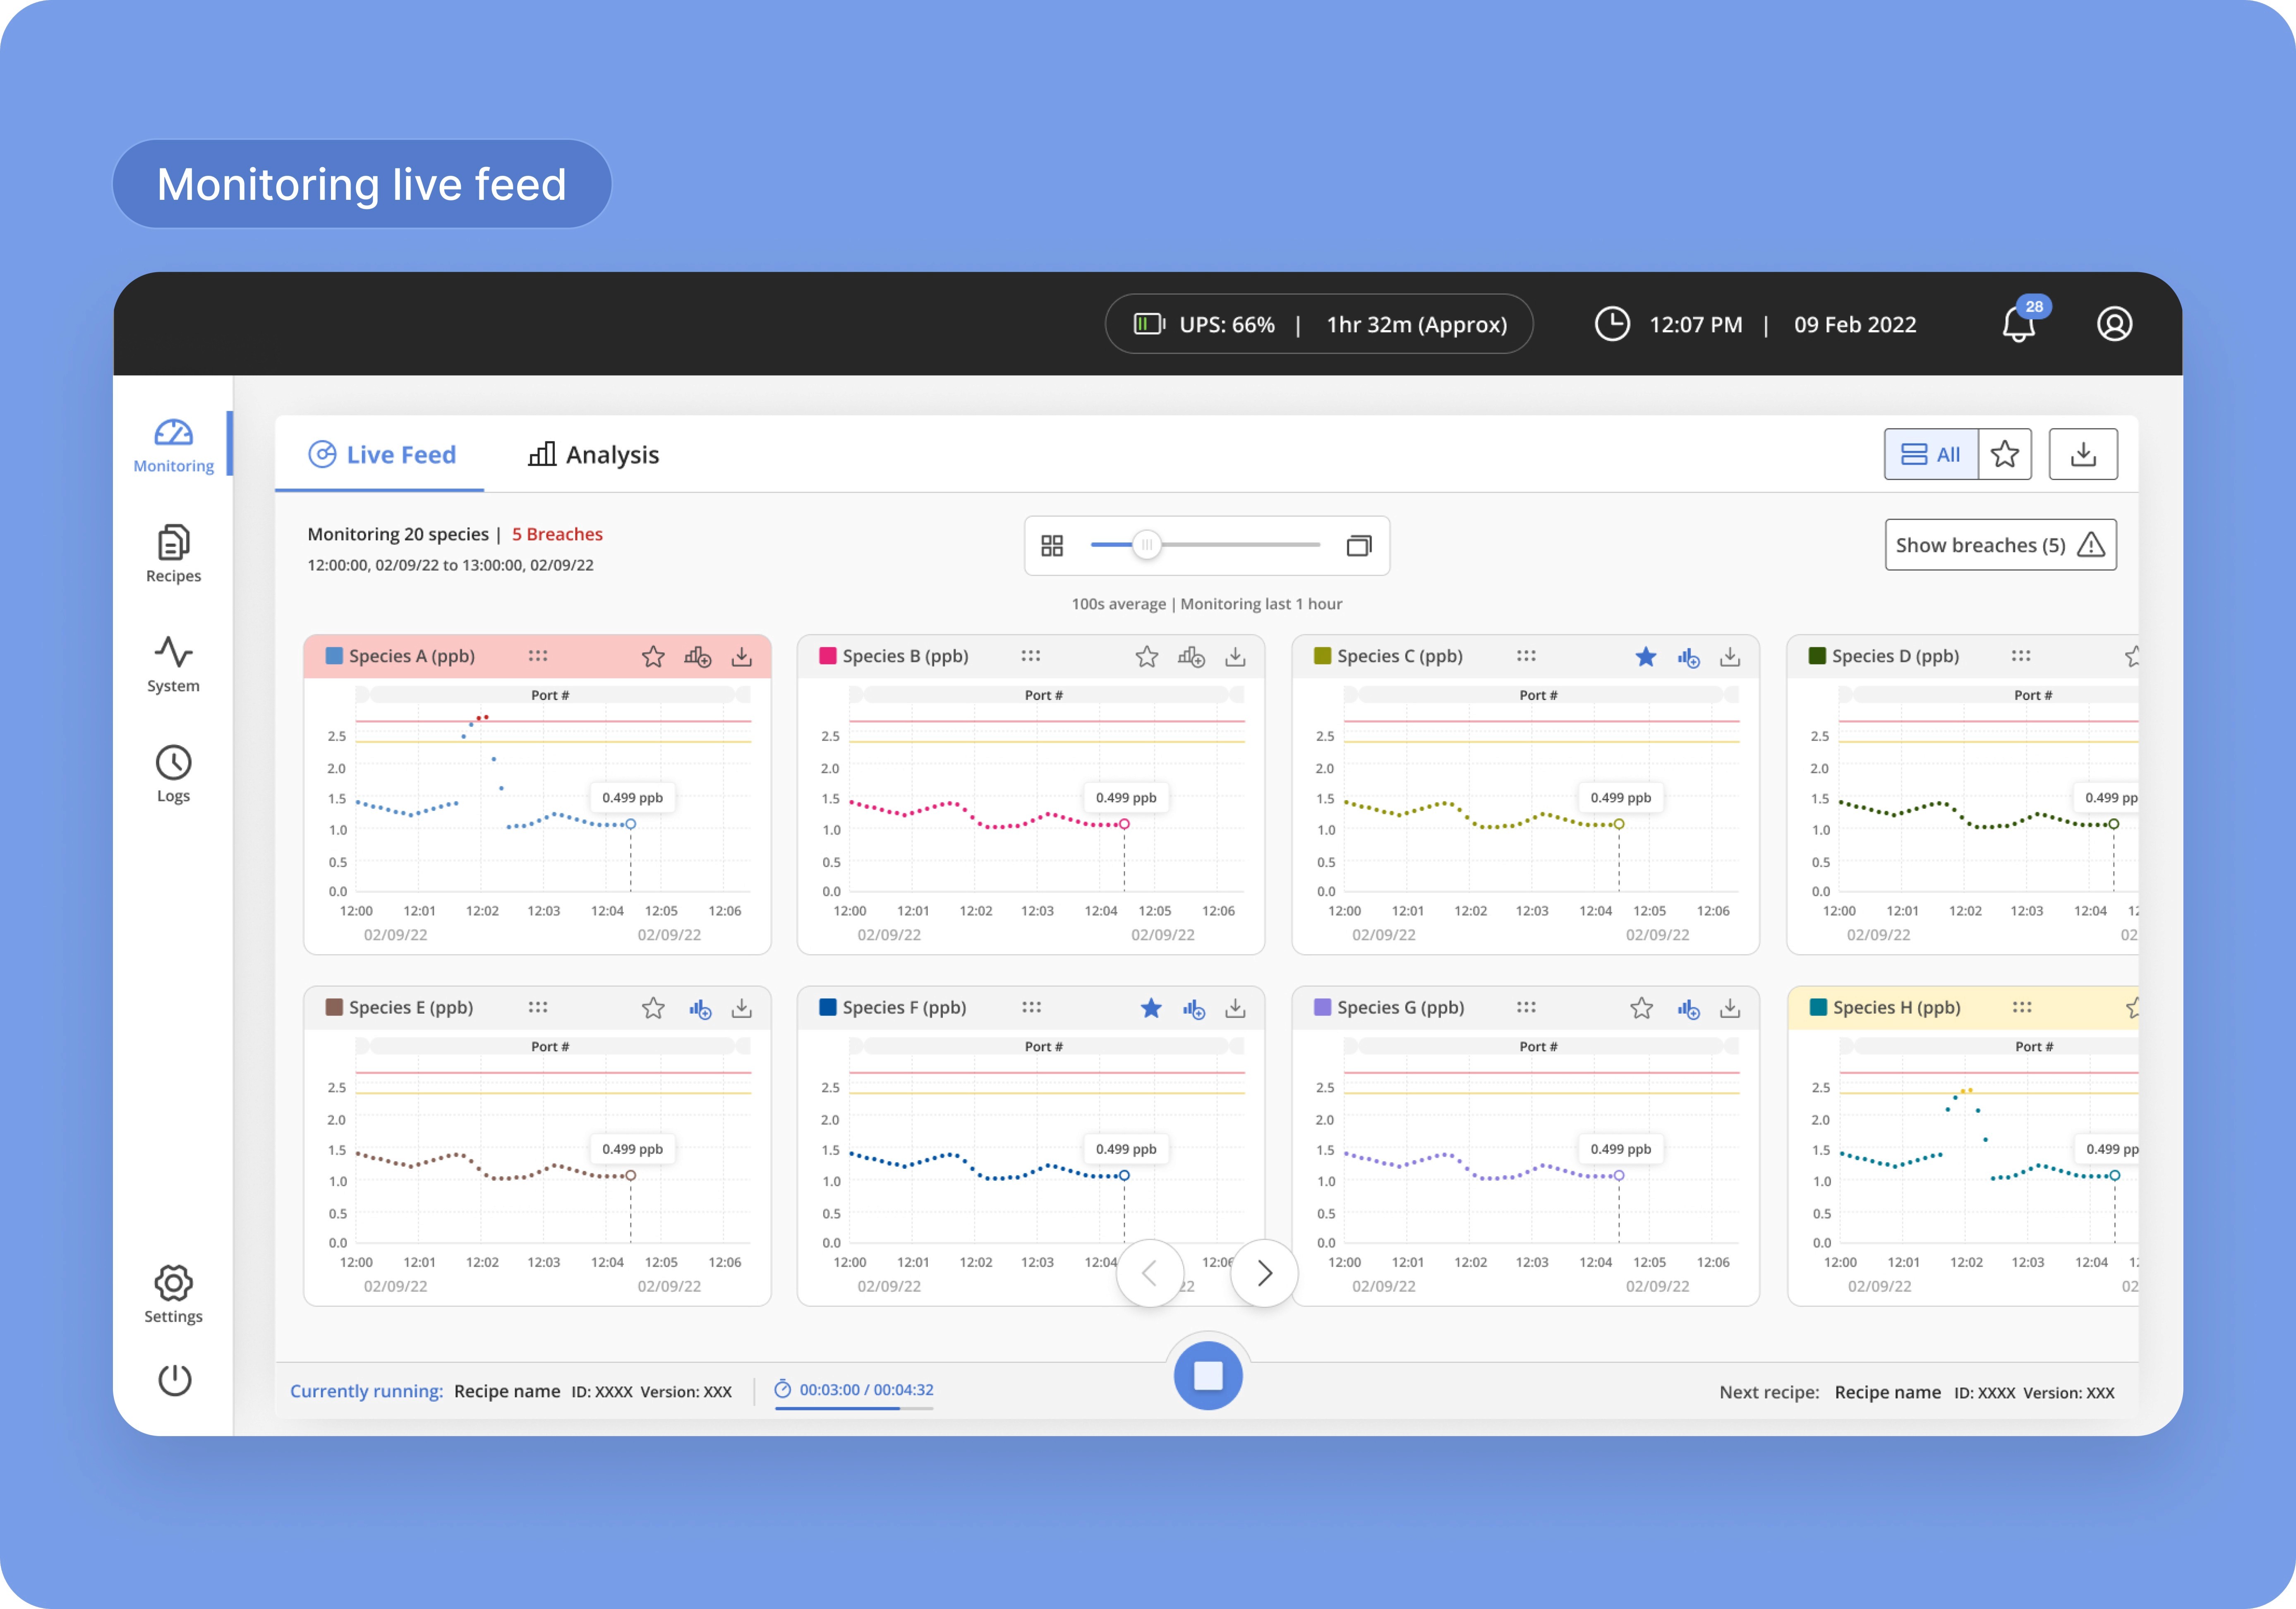
The existing UI presented an information overload, particularly on the monitoring screen, which is frequently used for real-time viewing of various gases. To address this, we employed progressive disclosure, offering users multiple zoom levels to navigate the content. By introducing four card sizes, each progressively zooming in, from a simple color indicator to a full-page view for each gas species, we effectively managed the complexity of the displayed data.
The existing UI presented an information overload, particularly on the monitoring screen, which is frequently used for real-time viewing of various gases. To address this, we employed progressive disclosure, offering users multiple zoom levels to navigate the content. By introducing four card sizes, each progressively zooming in, from a simple color indicator to a full-page view for each gas species, we effectively managed the complexity of the displayed data.
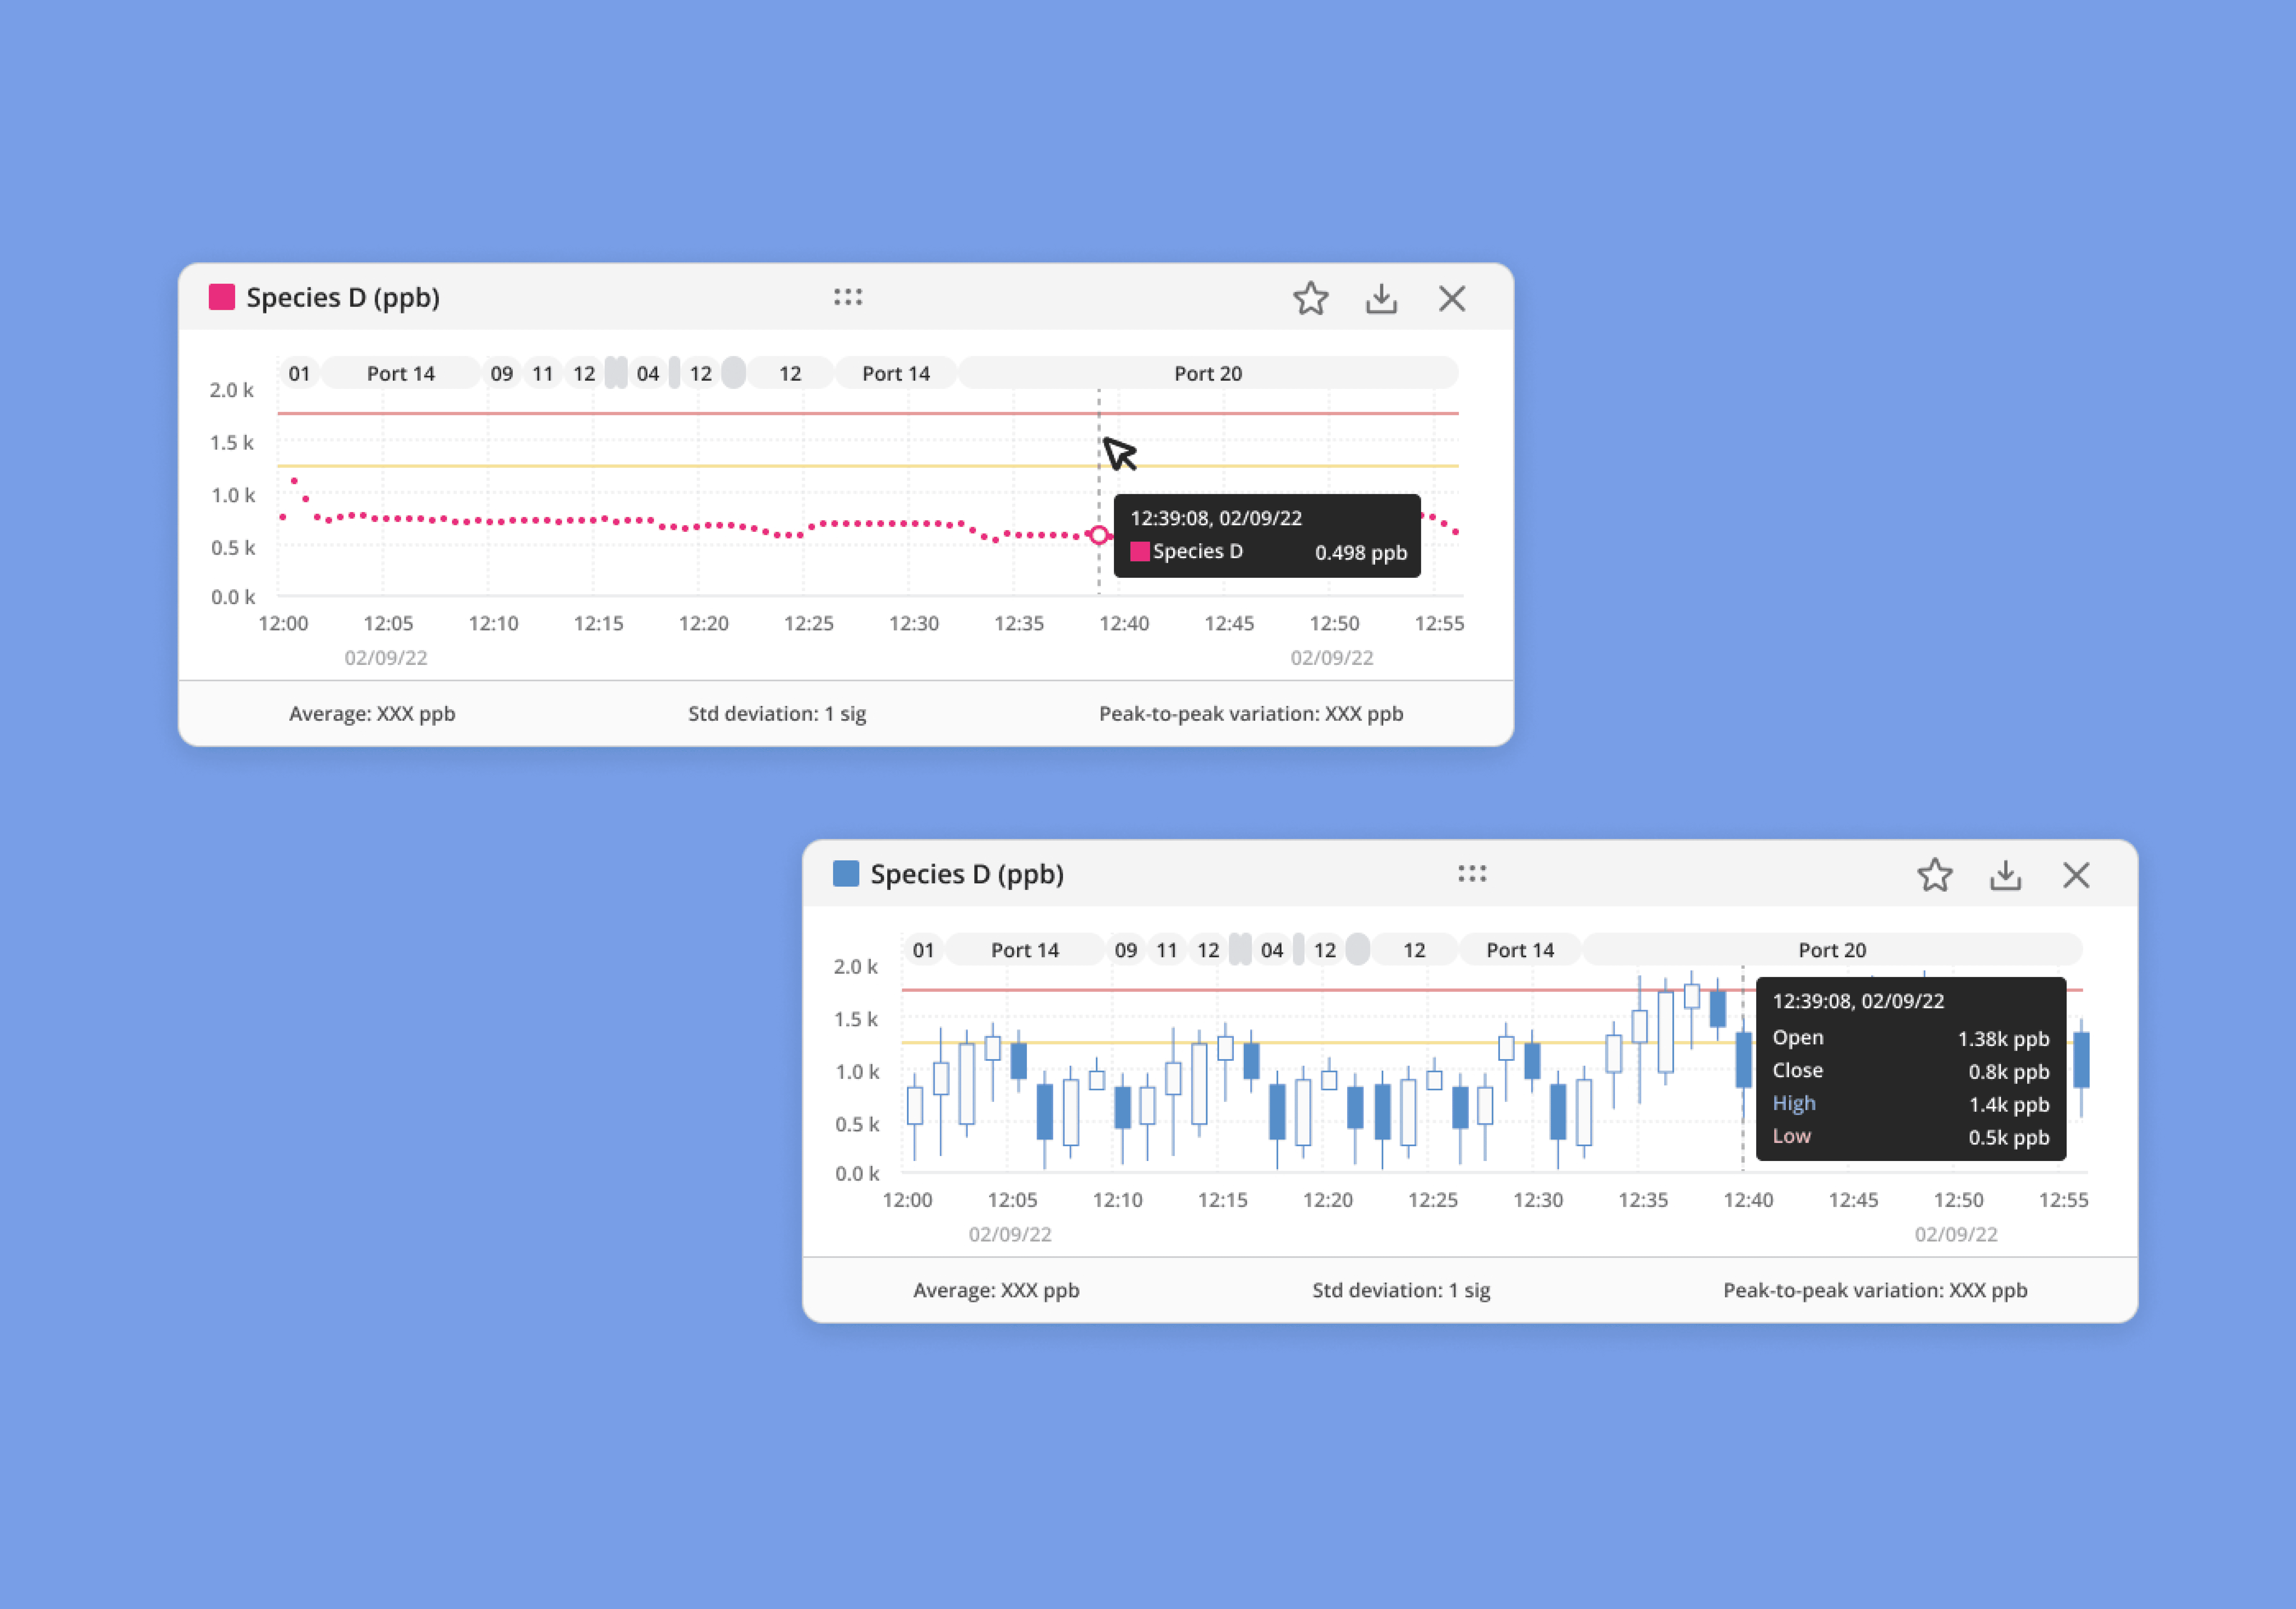
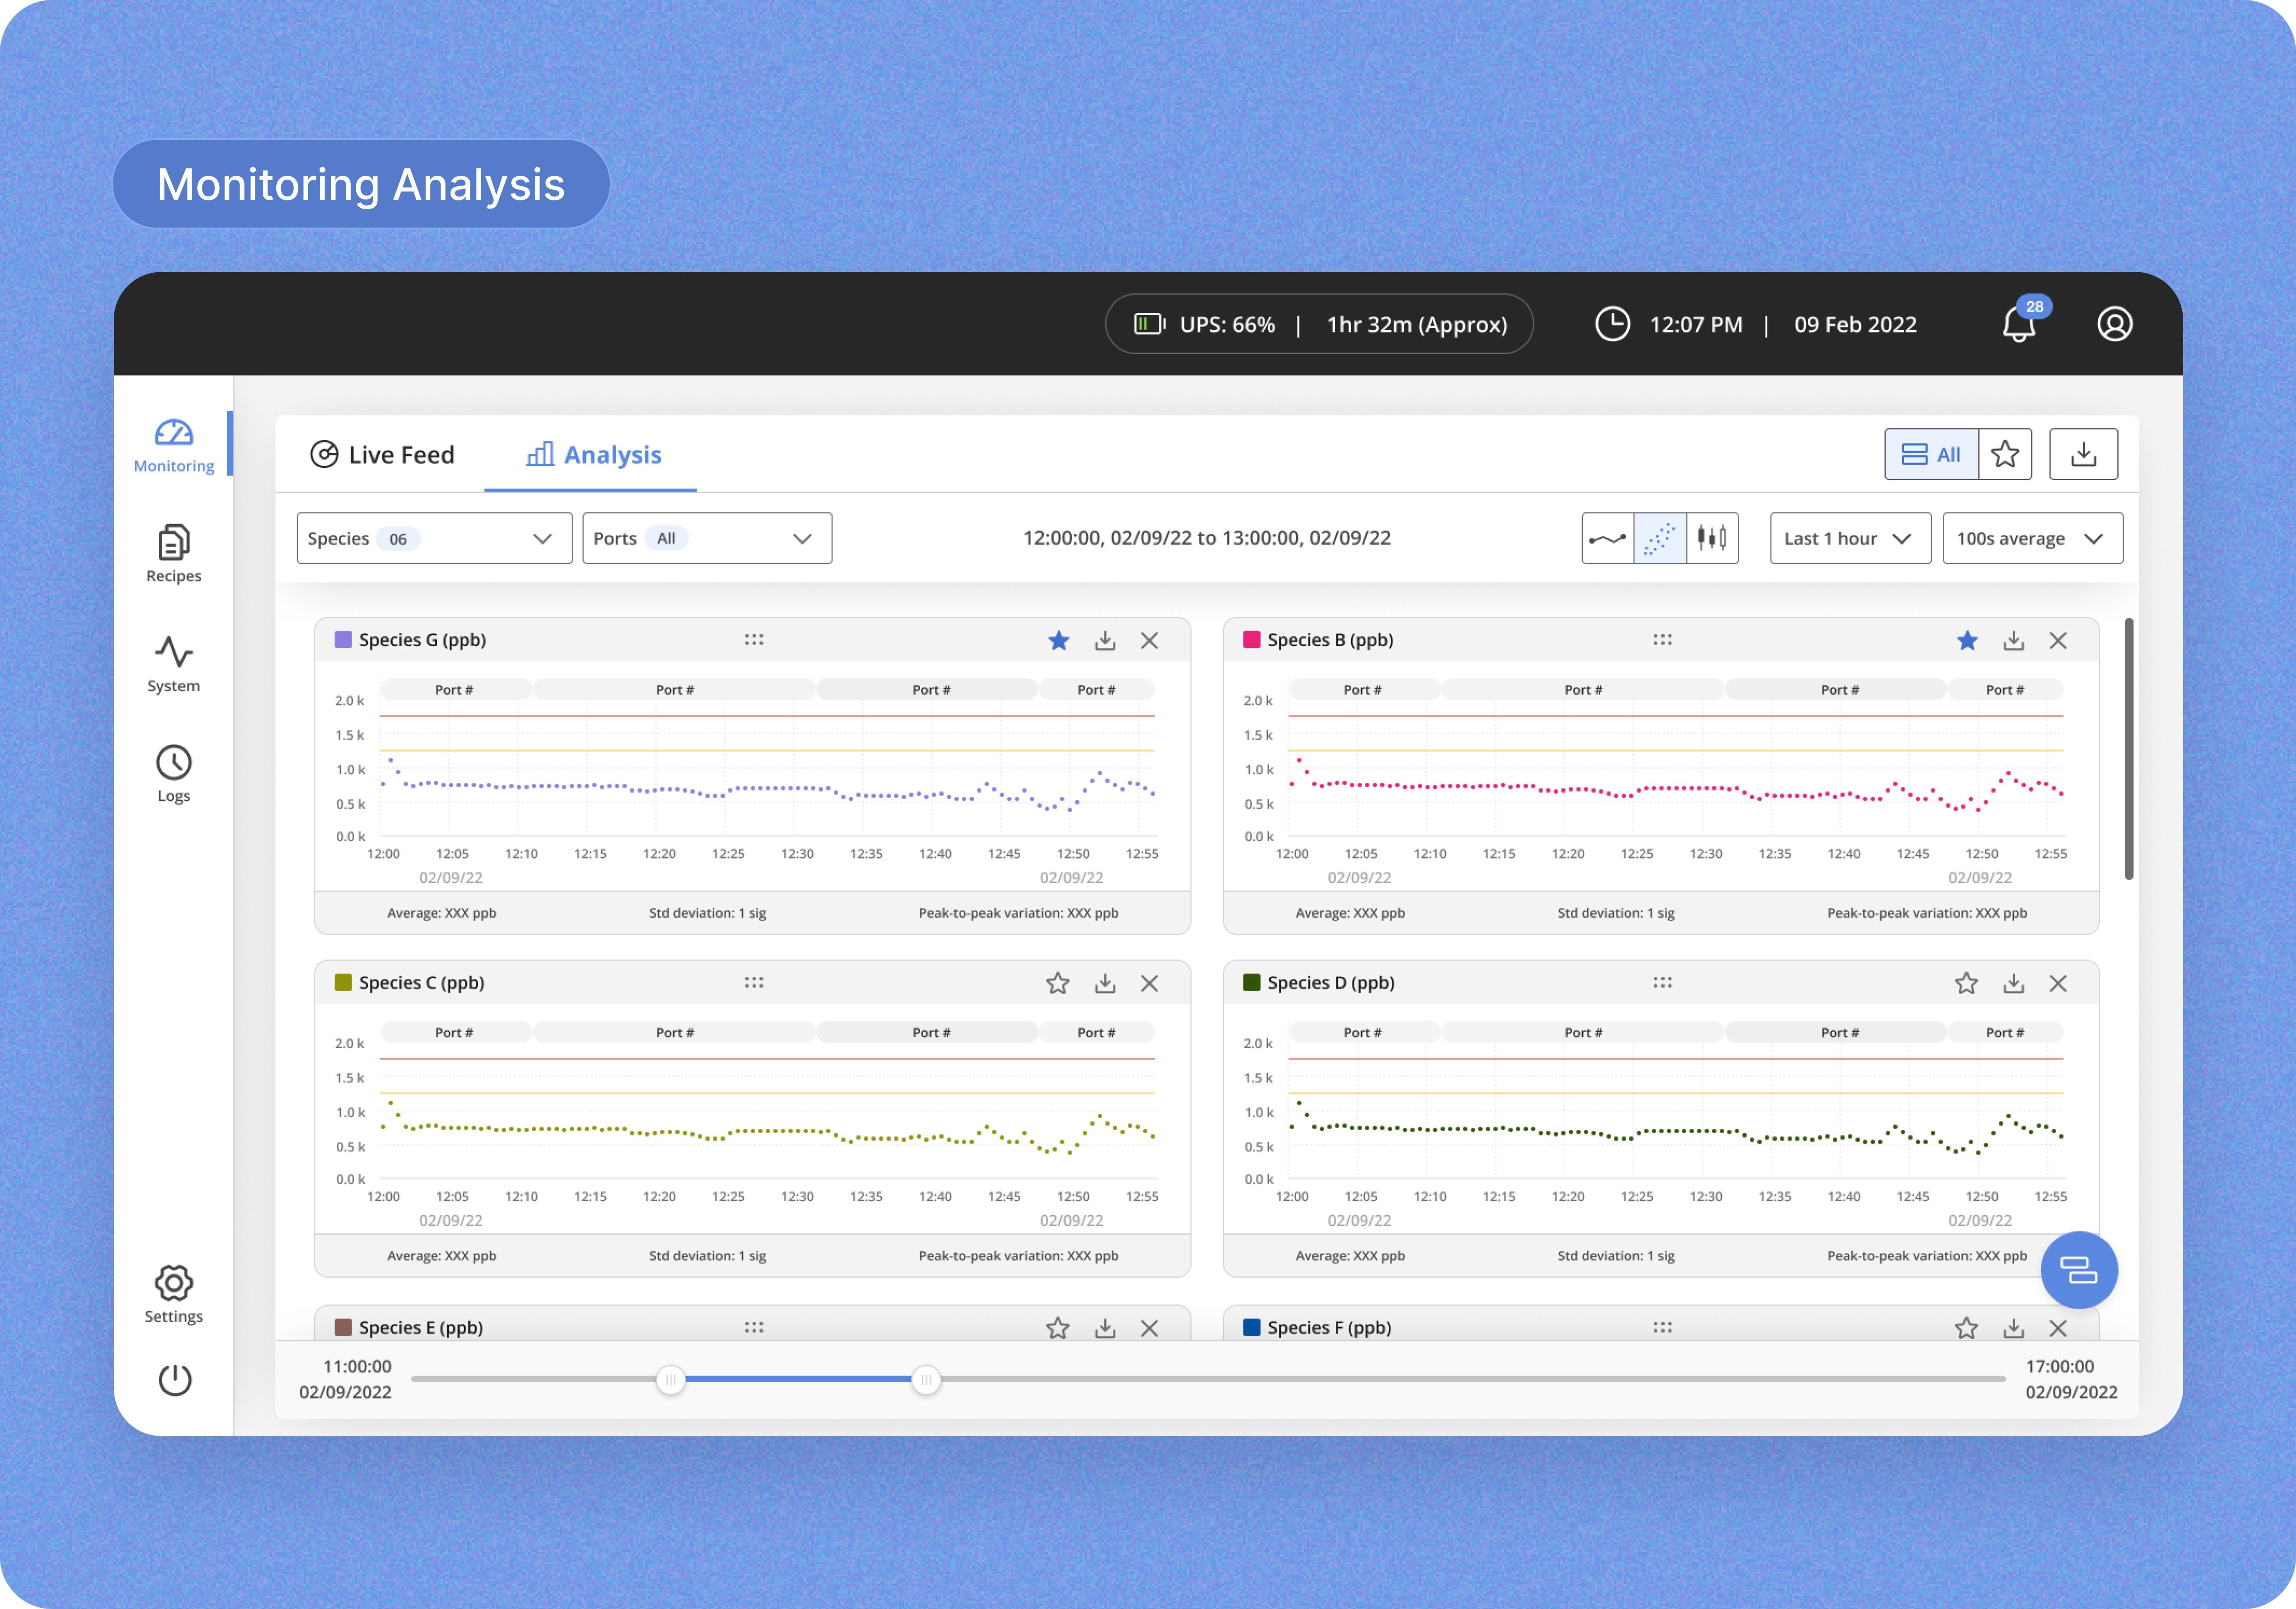
Comparing and analysing data
Comparing and analysing data
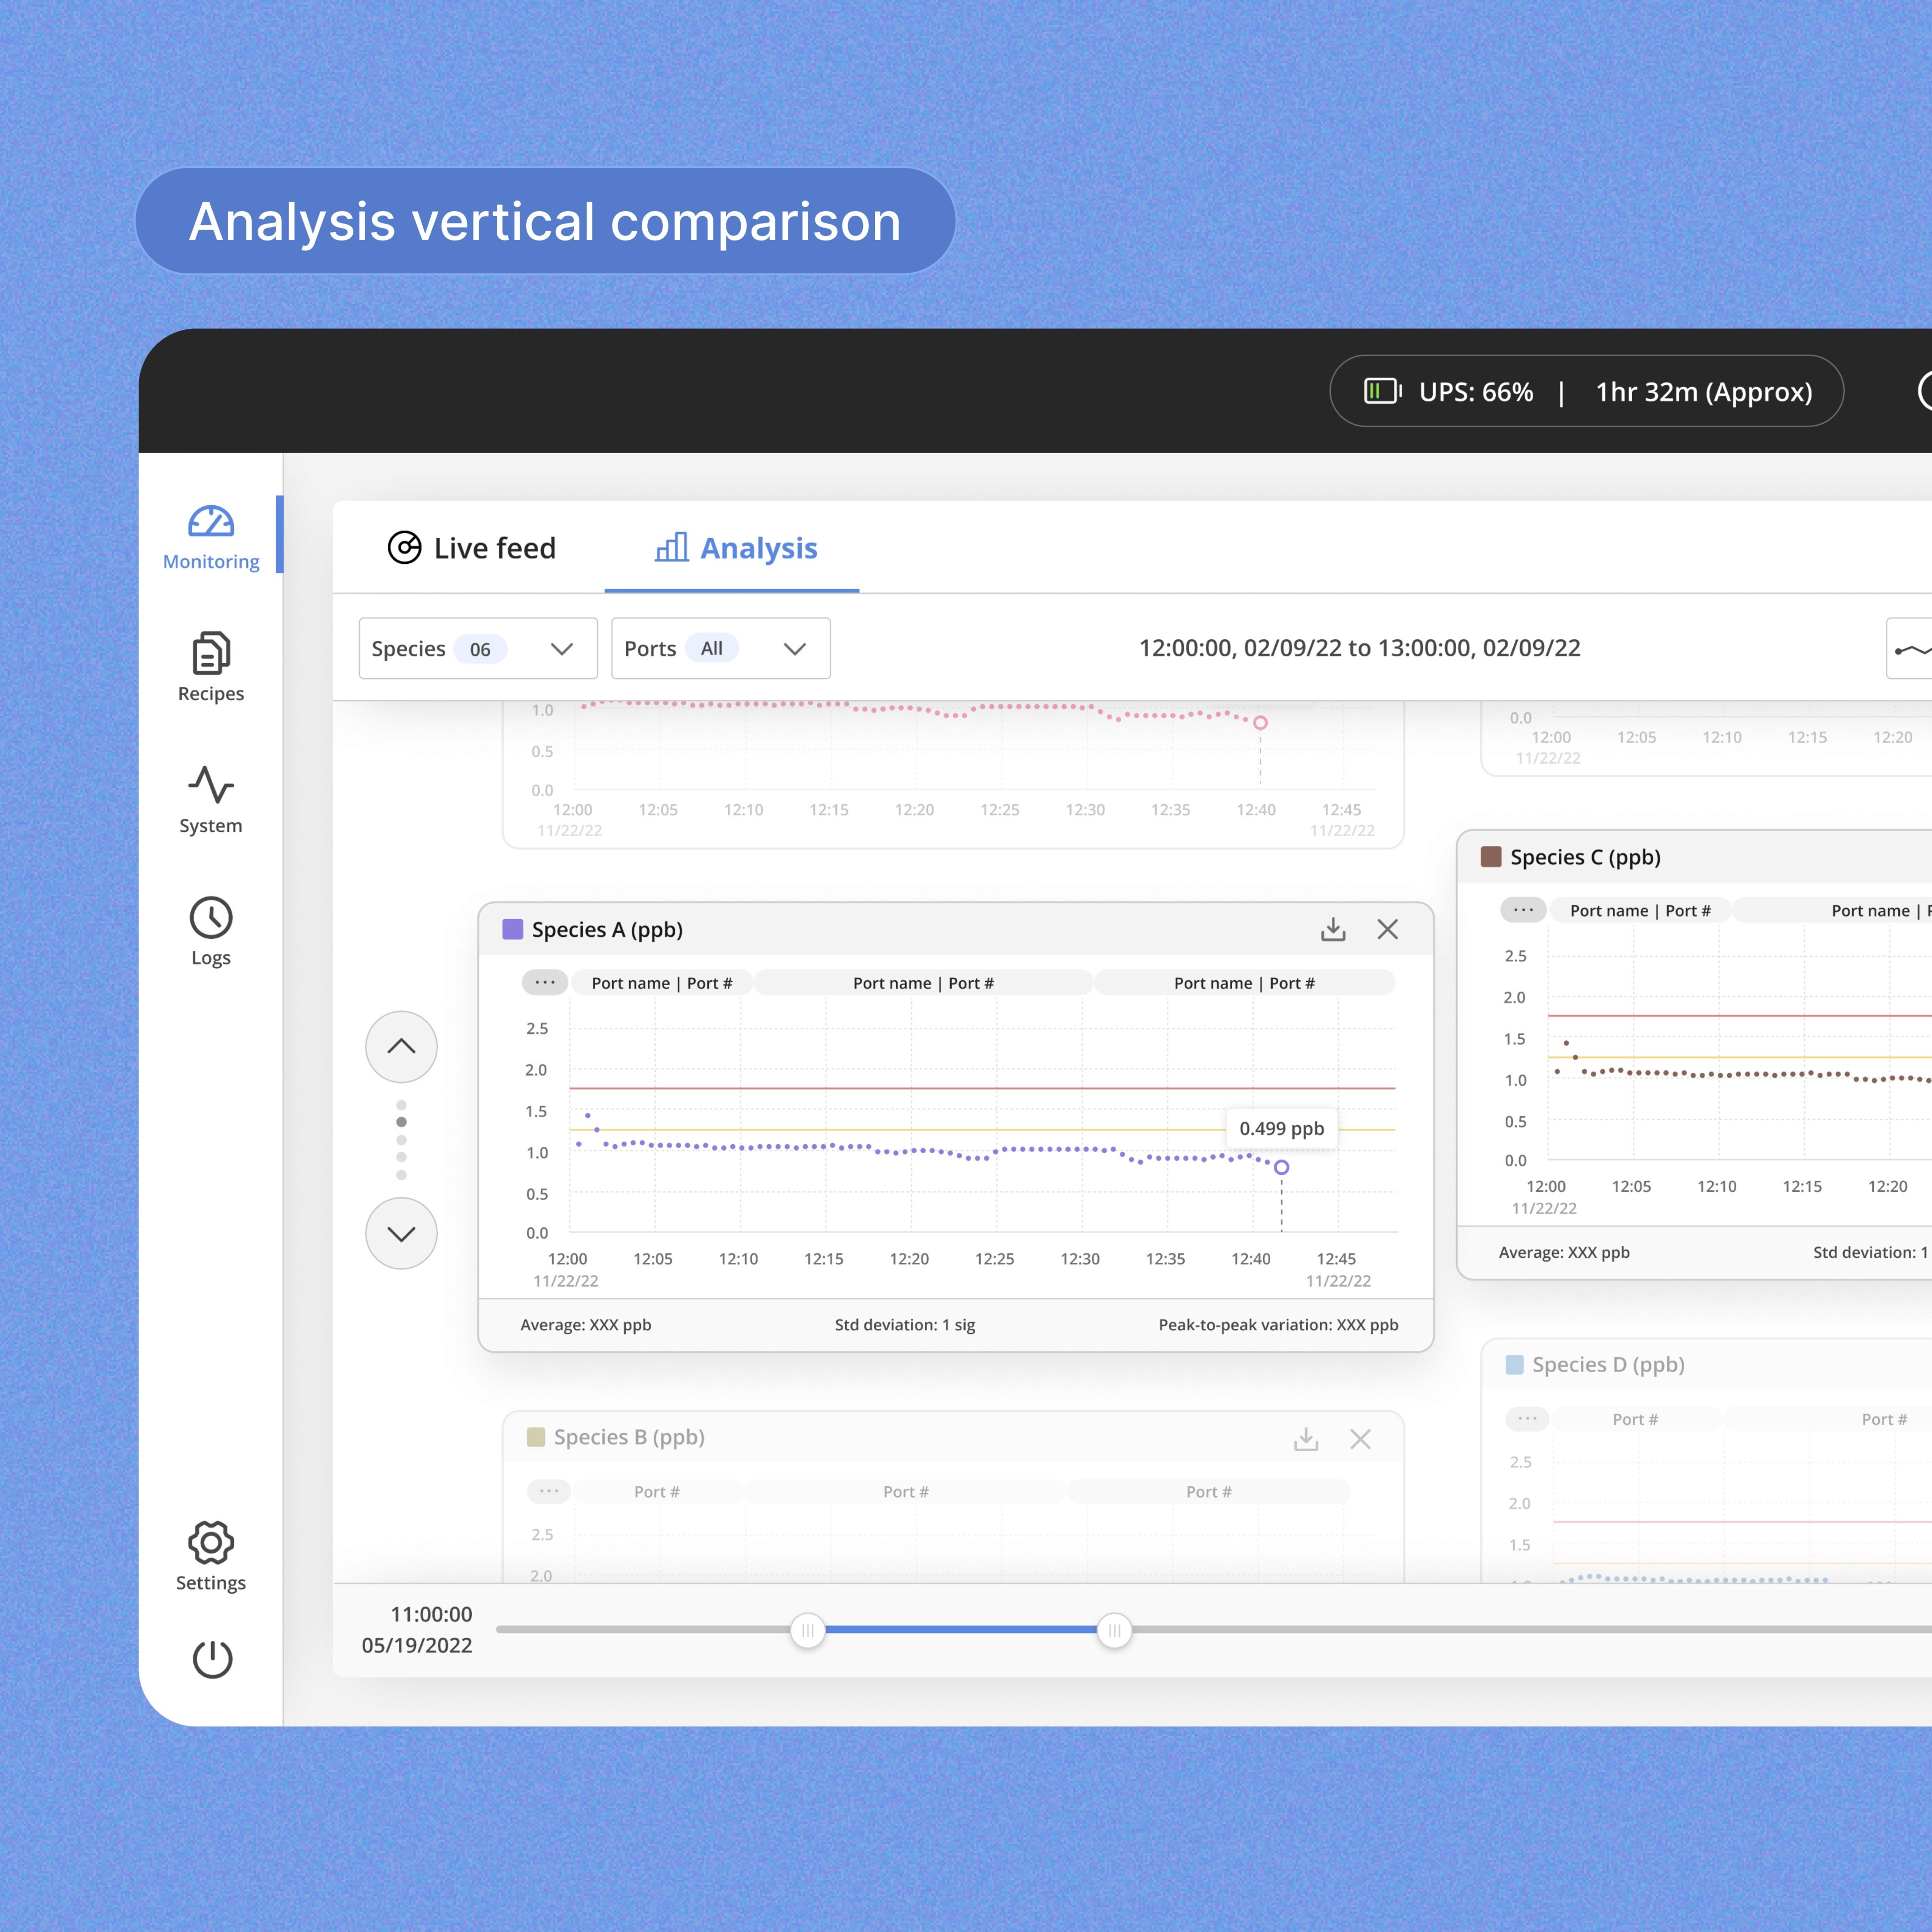
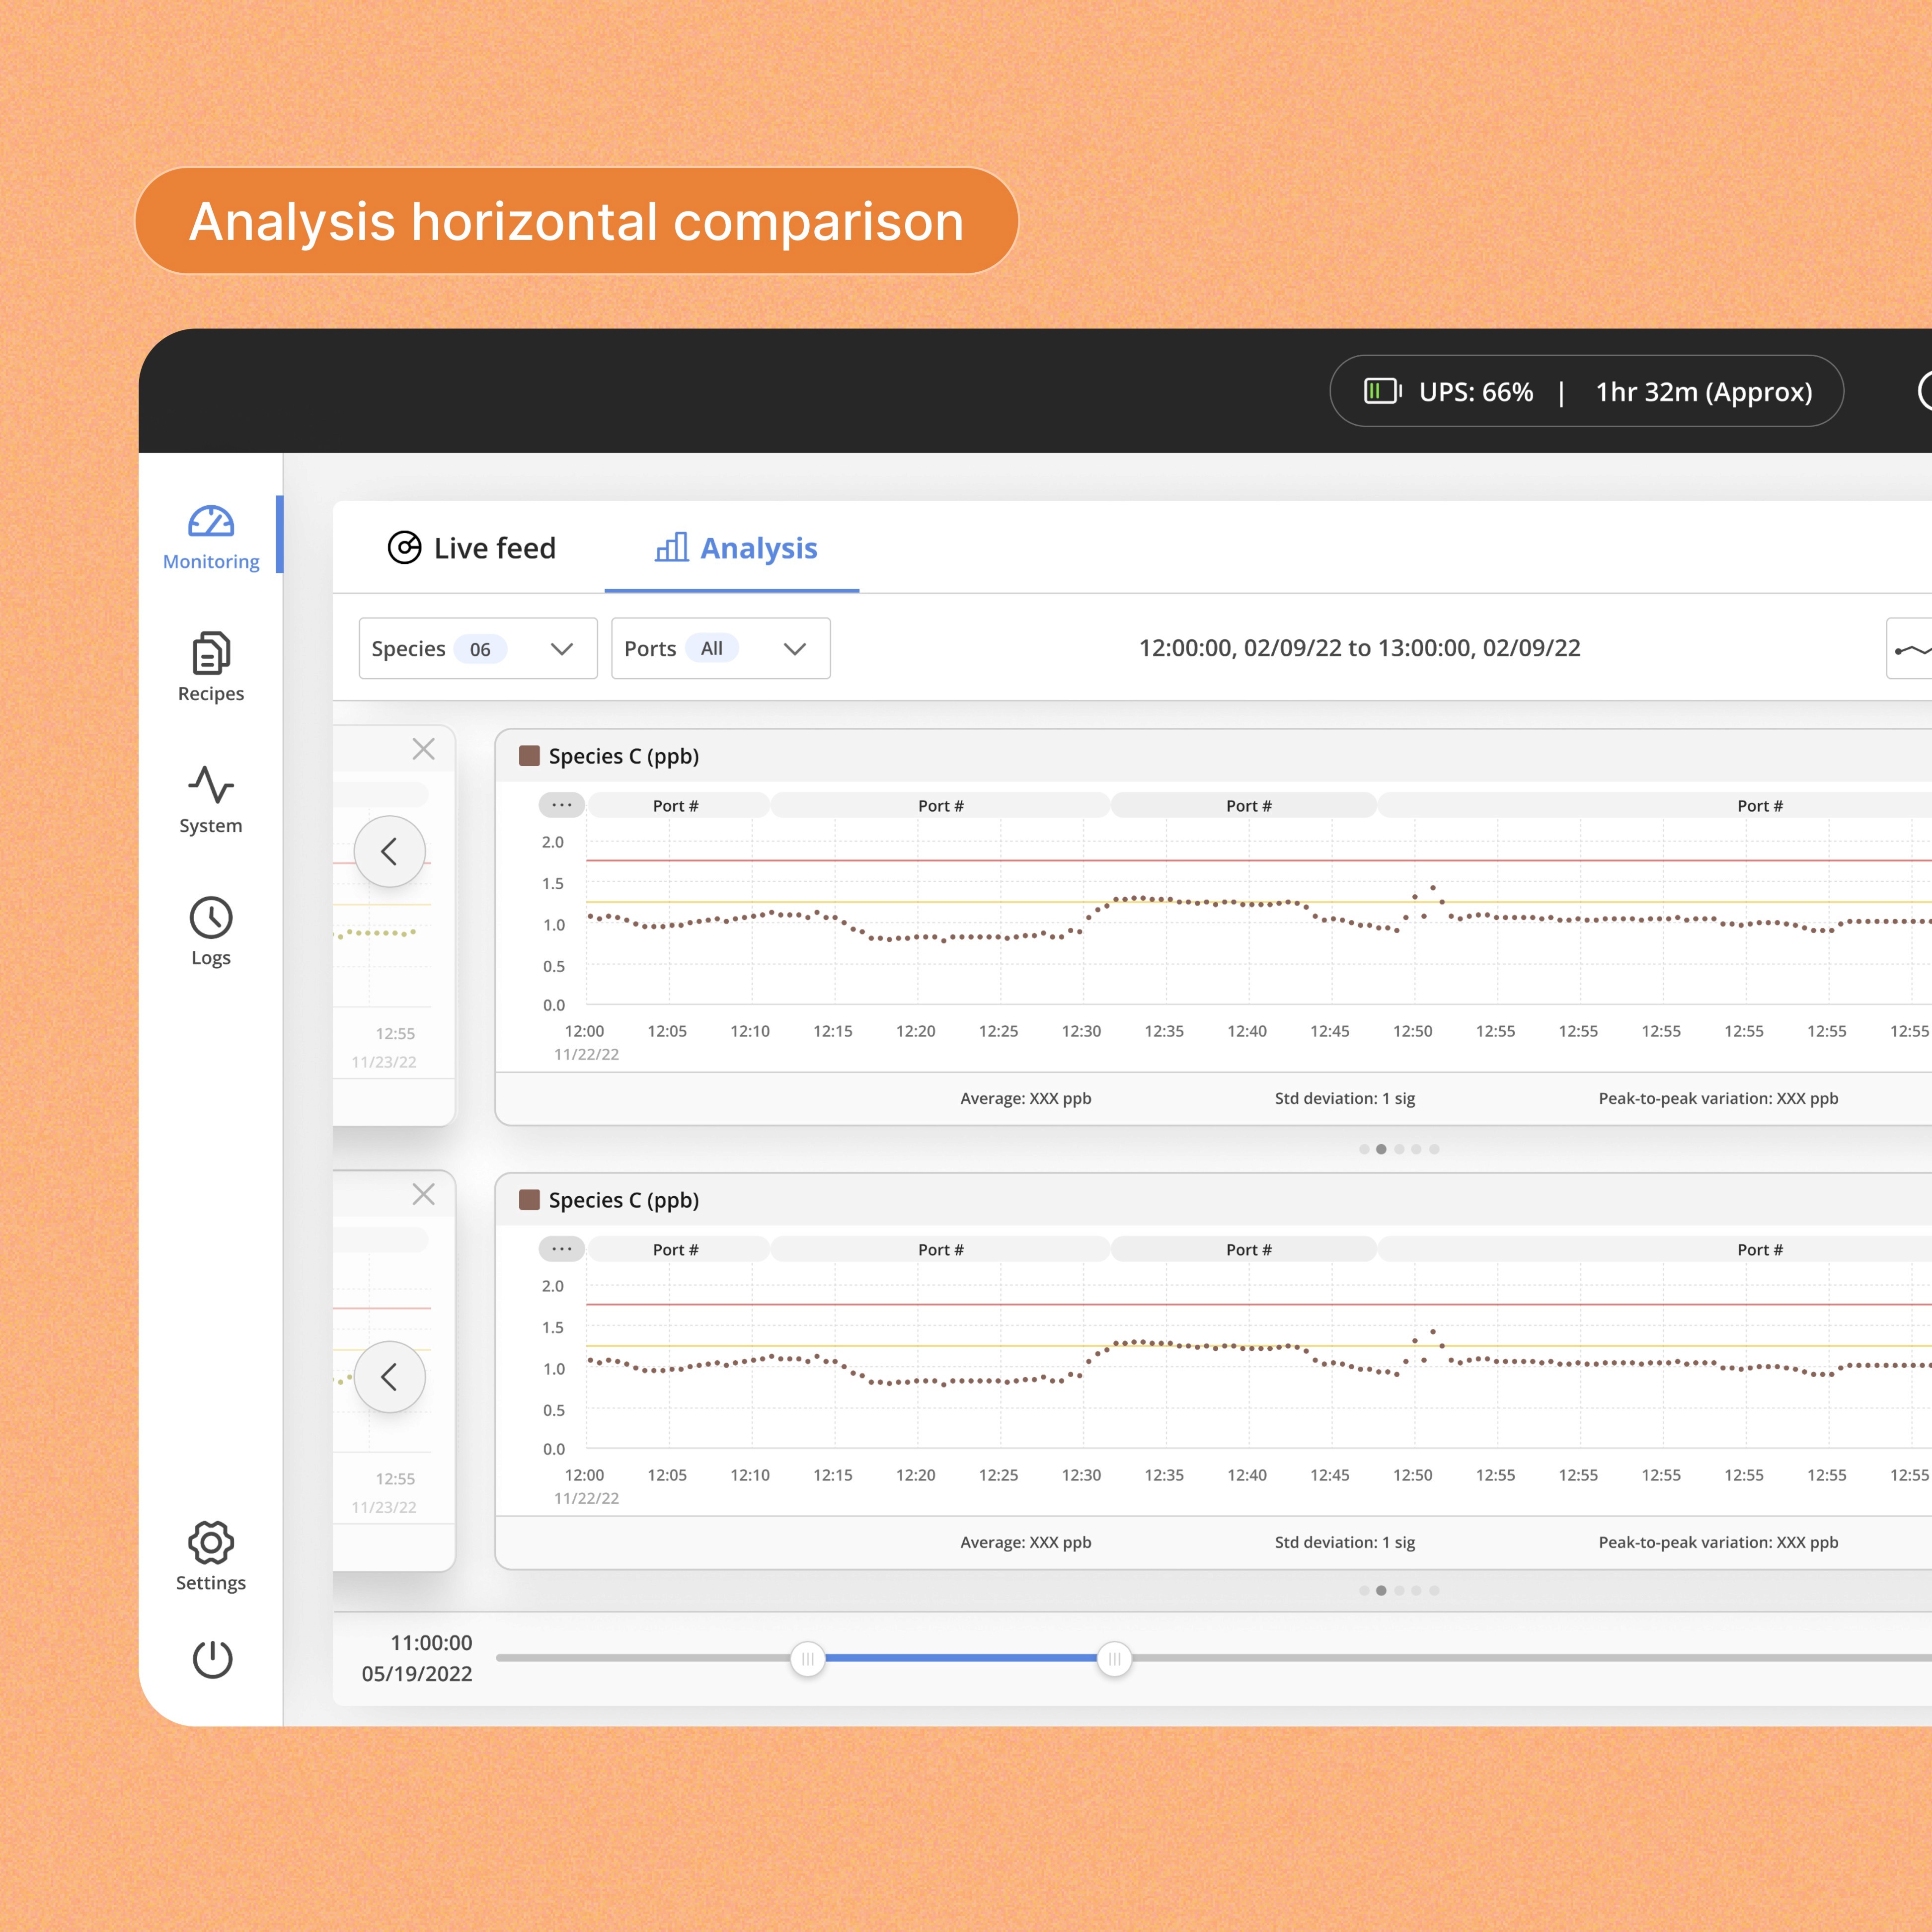
On the analysis page, engineers can compare and analyze two chosen species. They begin by selecting the species for comparison and adding them to the analysis. The analysis tab then displays both species cards side by side, allowing engineers to navigate through their selections using arrow buttons. Additionally, we incorporated a feature enabling them to switch between vertical and horizontal views based on their preferences.
On the analysis page, engineers can compare and analyze two chosen species. They begin by selecting the species for comparison and adding them to the analysis. The analysis tab then displays both species cards side by side, allowing engineers to navigate through their selections using arrow buttons. Additionally, we incorporated a feature enabling them to switch between vertical and horizontal views based on their preferences.
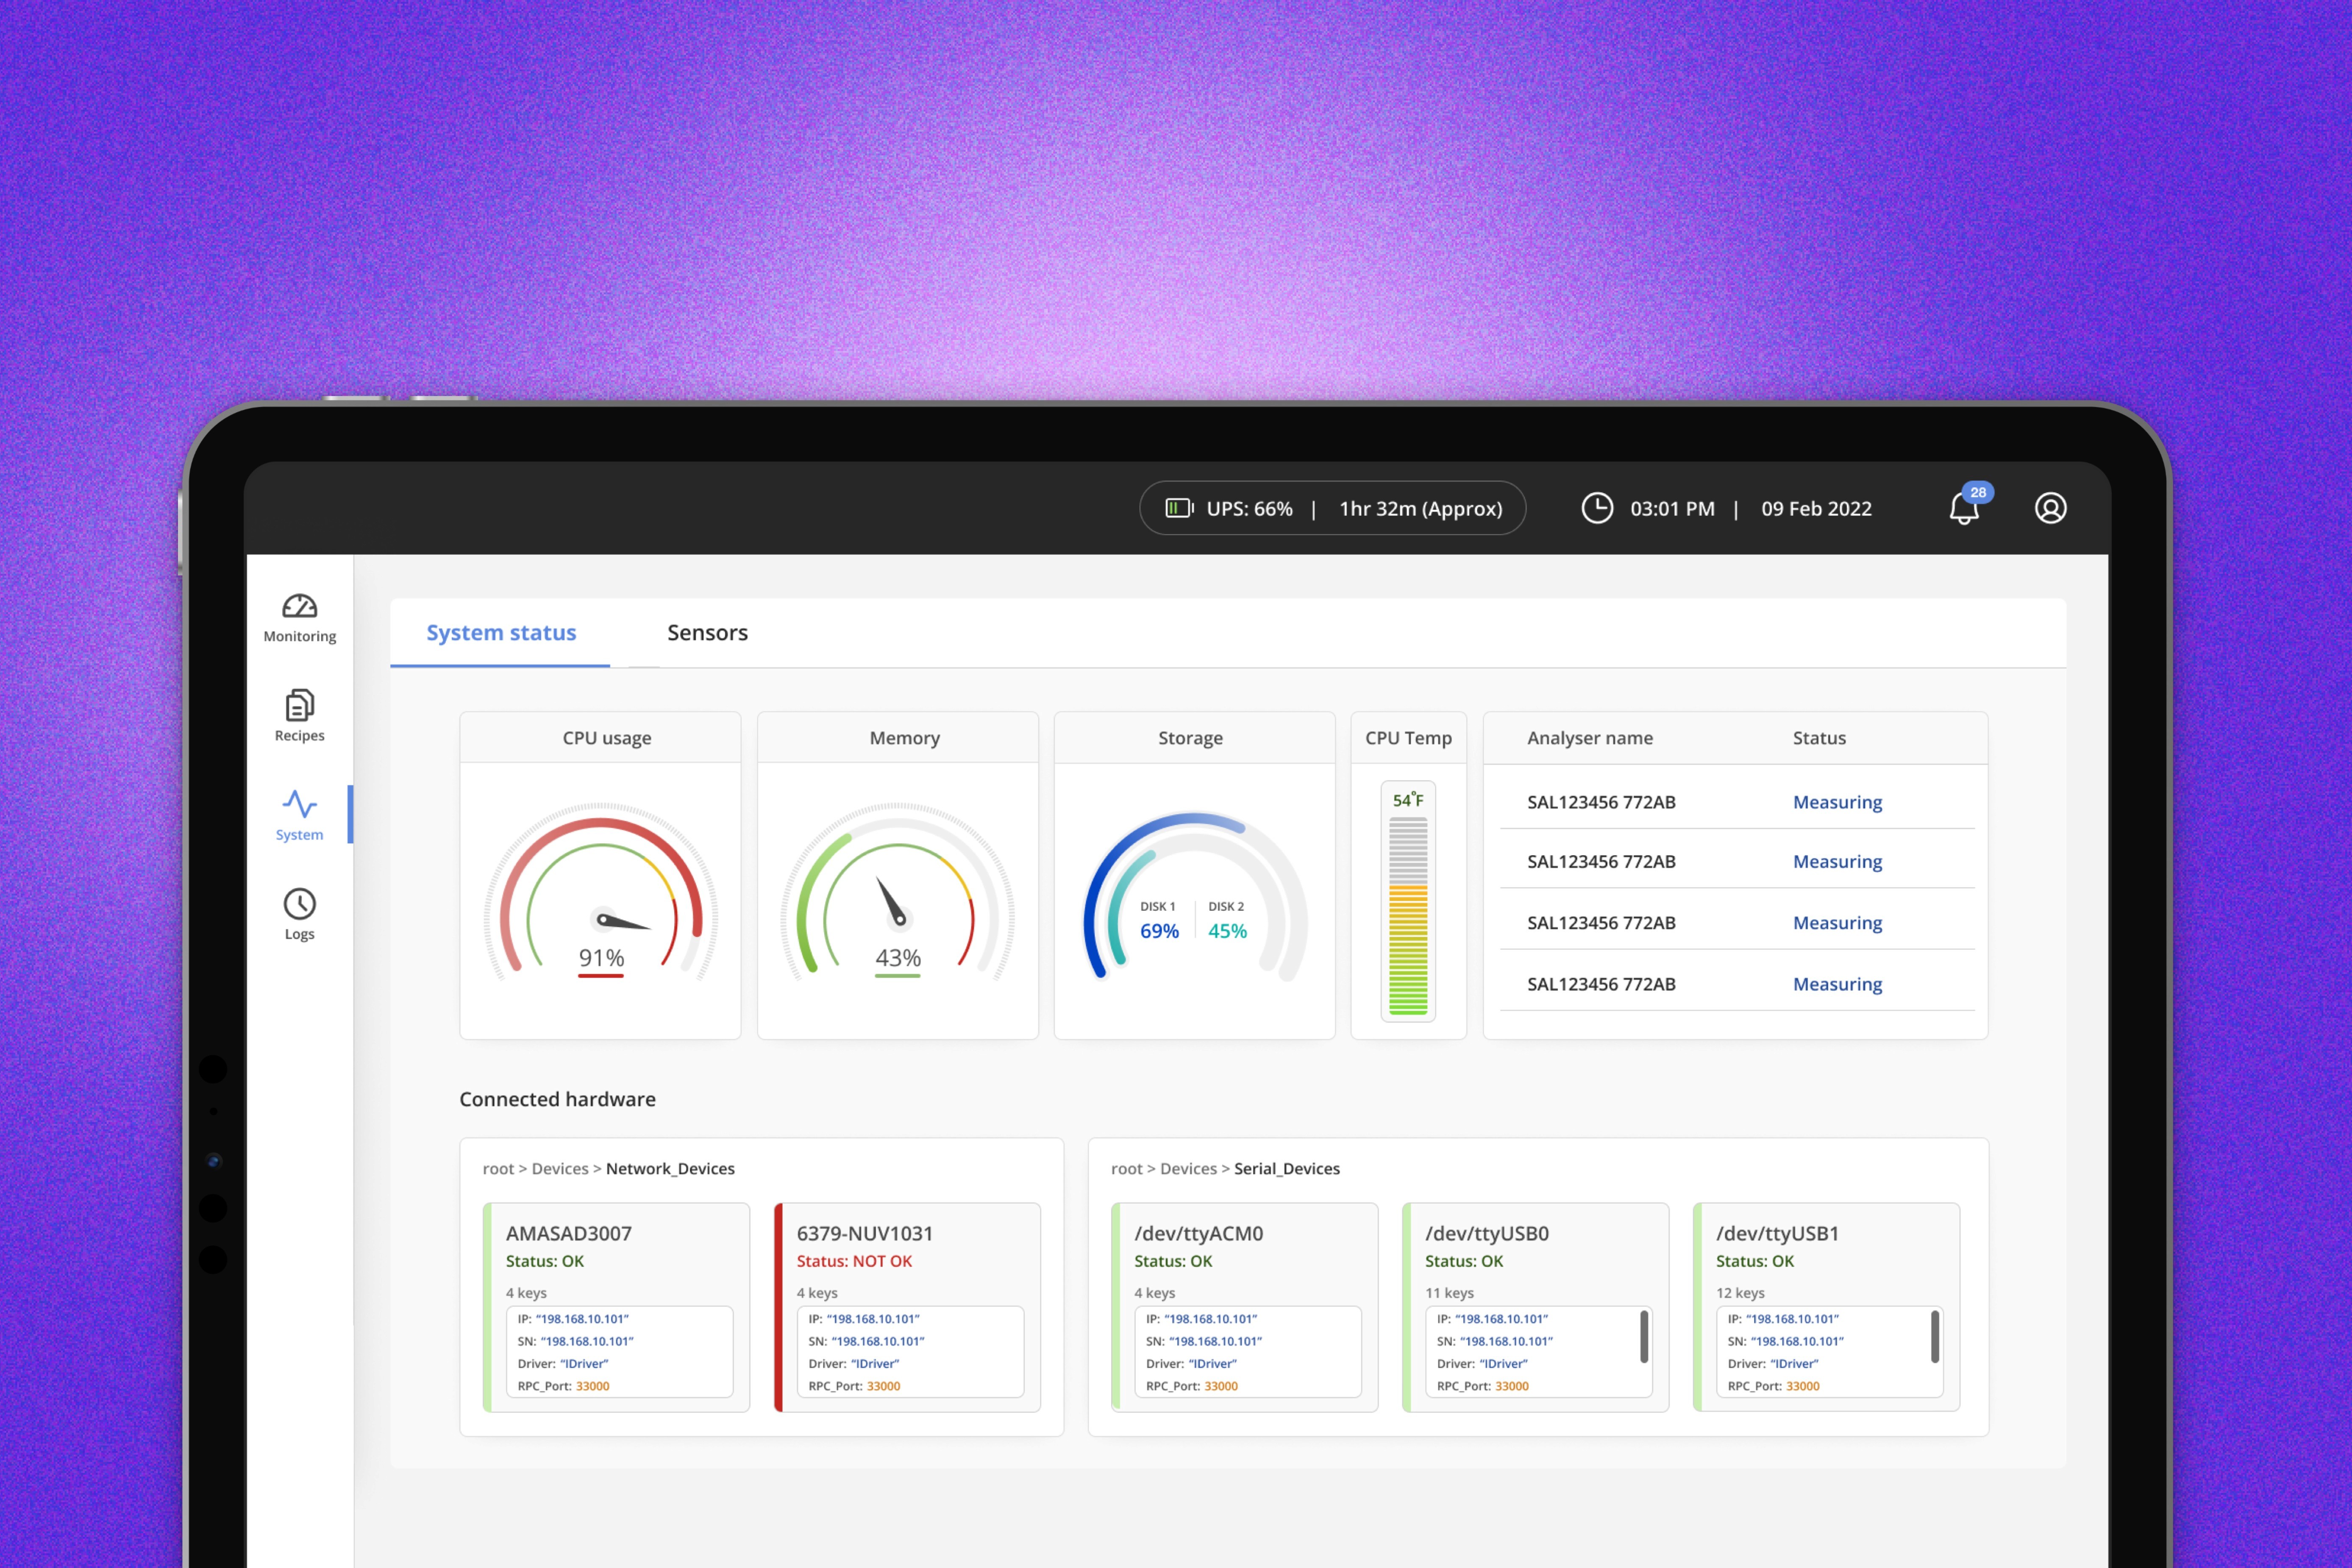
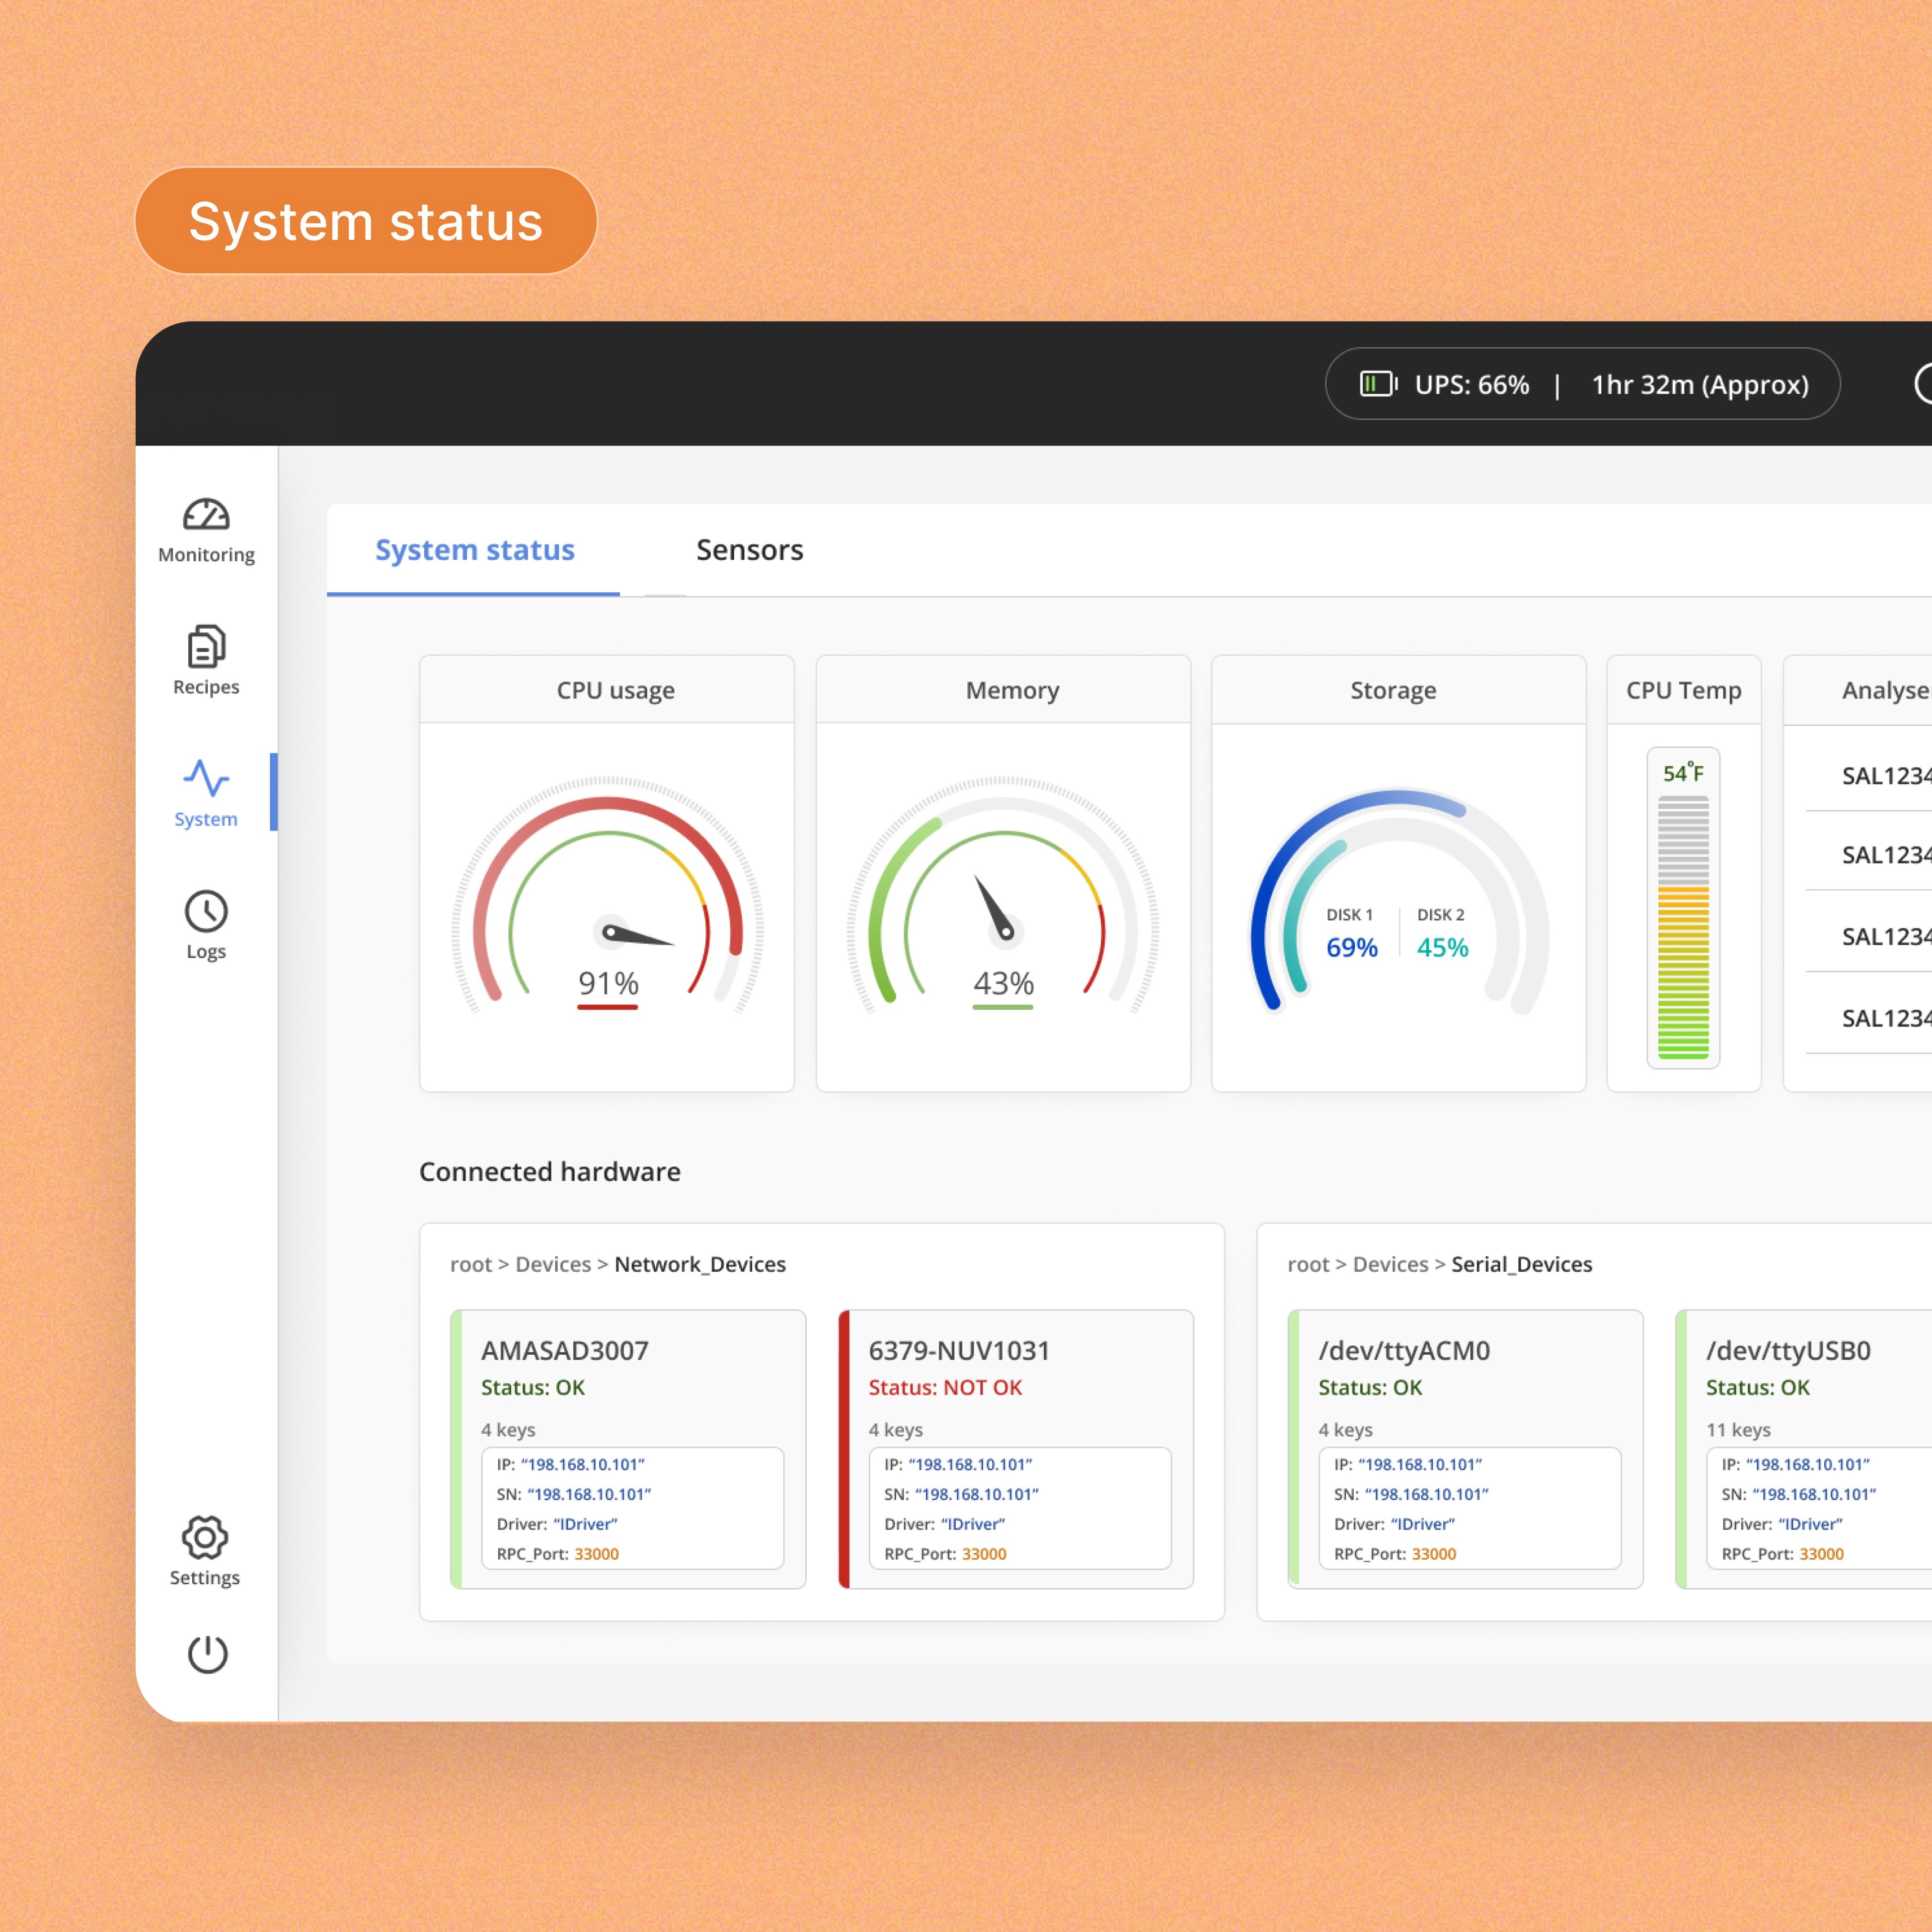
Designing for errors and edge cases
Designing for errors and edge cases
Designing for errors and edge cases
We designed robust error handling and addressed edge cases for system resilience. Clear error messages guide users through tasks and unexpected scenarios. Simultaneously, we created concise documentation and assets for all edge cases, streamlining the developer handoff and ensuring seamless implementation.
We designed robust error handling and addressed edge cases for system resilience. Clear error messages guide users through tasks and unexpected scenarios. Simultaneously, we created concise documentation and assets for all edge cases, streamlining the developer handoff and ensuring seamless implementation.
We designed robust error handling and addressed edge cases for system resilience. Clear error messages guide users through tasks and unexpected scenarios. Simultaneously, we created concise documentation and assets for all edge cases, streamlining the developer handoff and ensuring seamless implementation.
Learnings & takeaways
Learnings & takeaways
Learnings & takeaways
Balancing pace and perfection
Balancing pace and perfection
As it was a fast paced project, there was need to strike the balance between speeding up towards the deadline but also take care of the important details.
As it was a fast paced project, there was need to strike the balance between speeding up towards the deadline but also take care of the important details.
Understanding the context
Understanding the context
As the project domain was unfamiliar to us, we devoted our initial weeks to gaining an understanding of the machine's purpose and its present usage. A portion of this time was spent familiarising ourselves with the current dashboard and its role in managing the system.
As the project domain was unfamiliar to us, we devoted our initial weeks to gaining an understanding of the machine's purpose and its present usage. A portion of this time was spent familiarising ourselves with the current dashboard and its role in managing the system.
Receiving feedback and iterating
Receiving feedback and iterating
Constantly engaging with the team and stakeholders to receive feedback on the constraints, limitations or requirements to iterate or revise the components to build the UI. We also got to speak with the users and validate the designs.
Constantly engaging with the team and stakeholders to receive feedback on the constraints, limitations or requirements to iterate or revise the components to build the UI. We also got to speak with the users and validate the designs.
Working across timezones
Working across timezones
Given that the stakeholders and senior designer were located in different time zones, this was an opportunity for us to acquire time management skills and learn to collaborate effectively.
Given that the stakeholders and senior designer were located in different time zones, this was an opportunity for us to acquire time management skills and learn to collaborate effectively.
Harshini Narendra • Experience Designer
Toodles! ✨
Harshini Narendra
Toodles! ✨